
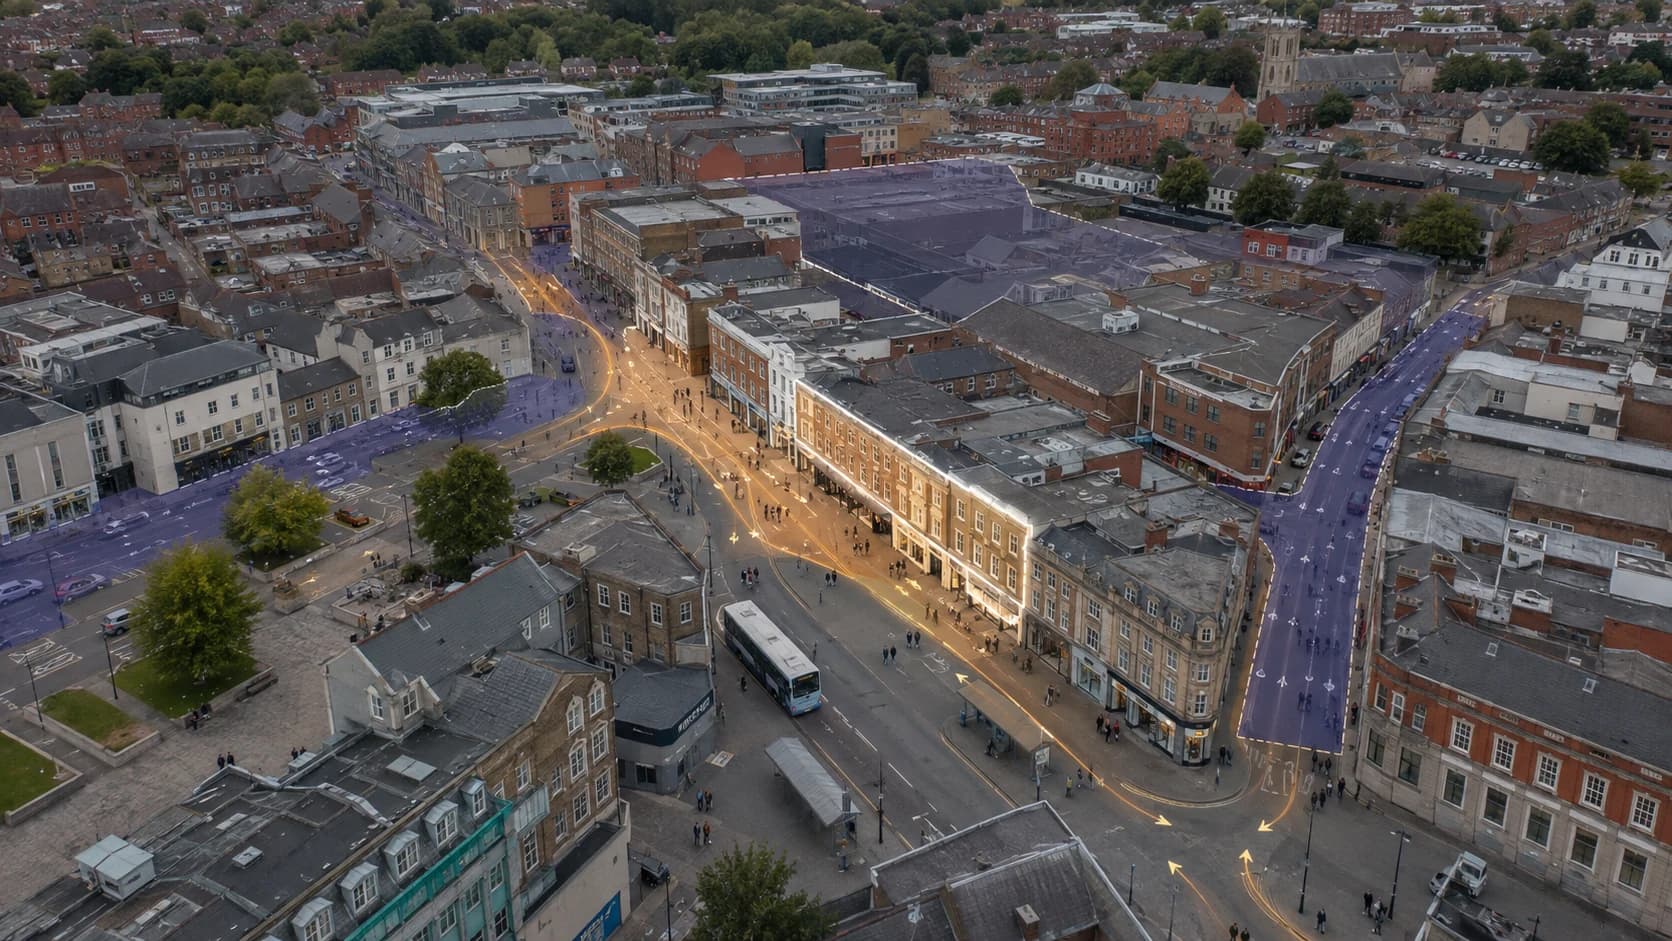
Foot Traffic Analysis for Retail: What to Measure
Use foot traffic analysis for retail site decisions by comparing daypart fit, catchment, competition, access, and evidence quality.
Ahmed
Founder of Locus
Foot traffic analysis for retail helps teams judge whether customer activity around a location matches the store concept, trading hours, and catchment. The useful question is not simply “How many people are there?” but “Which activity signal is being measured, when does it happen, and can this site turn it into reachable demand?”
That distinction matters before a lease, acquisition, or rollout decision. A busy road can produce little store traffic; a quieter-looking street can perform well when its visitors match the offer and arrive at the right times.
What does foot traffic analysis measure?
“Foot traffic” can describe several different signals. Treating them as interchangeable is one of the fastest ways to overstate a location’s potential.
- Pedestrian flow: people passing through a street, centre, or defined area.
- Entries: people crossing a store threshold, usually measured by a counter or sensor.
- Venue busyness: relative activity associated with a venue or place over time.
- Catchment activity: the people and places that can realistically reach a site by walking, driving, cycling, or public transport.
- Conversion: the share of visitors who buy, which requires compatible transaction data.
Locus is most useful for the decision layer around these signals. Its location workflow can combine competitor activity patterns, hourly busyness where available, demographics, catchment views, business density, and an AI location assessment. Its foot-traffic heatmap is a relative signal derived from venue density and BestTime data; it is not a direct census of every passer-by or a promise of store entries.
A relative signal can help compare candidate areas and identify time-of-day patterns, but it should be checked against a site visit, landlord evidence, local knowledge, or direct counting when the decision requires an exact pedestrian total.
Which retail footfall metrics matter most?
Start with the metrics that connect to the operating model rather than collecting every available number.
1. Volume and trend
Measure activity across comparable periods: weekday versus weekend, school-term versus holiday, and opening hours versus closed hours. A single busy Saturday can hide a weak Monday-to-Thursday trading pattern. Trends are also more informative than a headline peak because they show whether the location is stable, seasonal, or changing.
2. Daypart fit
Match activity to the concept. A coffee shop may need morning and lunchtime demand; a convenience retailer may value evening and commuter flow; a destination furniture showroom may accept lower volume if visitors dwell longer and travel farther. The relevant score is therefore “fit during the hours that matter,” not raw activity across the whole day.
3. Capture and conversion
If you have reliable counts, use two ratios:
Capture rate = store entries ÷ people passing the frontage
Conversion rate = transactions ÷ store entries
They diagnose different problems. Low capture suggests visibility, frontage, offer, access, or storefront friction. Low conversion after healthy entry volume points toward merchandising, pricing, service, or product fit. If you only have venue busyness or area-level activity, do not label it as either rate.
4. Competitor and anchor context
Foot traffic is not automatically positive when every nearby operator competes for the same demand. Map direct competitors, complementary businesses, anchors, transport stops, and barriers between the activity signal and the candidate frontage. A cluster may create useful comparison shopping, or it may make a late entrant indistinguishable.
5. Evidence quality
Record the geography, time period, source, resolution, and known limitations for every signal. A venue-level popularity estimate, a mobile-device dataset, a landlord count, and a two-hour manual tally answer different questions. A defensible shortlist keeps those sources labelled instead of blending them into a falsely precise total.
How do you use foot traffic analysis before choosing a retail site?
Use a repeatable five-step pass for every candidate address.
- Define the customer and trading window. Write down the format, core customer, expected visit mission, opening hours, and the dayparts that must work. This prevents a high-volume but irrelevant signal from winning.
- Set the catchment. Compare the area by a radius and, where appropriate, a travel-time view. A one-mile ring is not the same as a ten-minute drive, and neither proves that people will cross a road, rail line, or shopping-centre boundary.
- Layer demand and competition. Add population, age, income, business density, complementary venues, direct competitors, and transport access. The goal is to explain who can reach the site and what they might do there.
- Compare dayparts. Check whether activity aligns with the proposed schedule. Look for a dependable base, not just one impressive peak.
- Write the decision and uncertainty. Note what the data supports, what it does not measure, and what should be verified on the ground before committing.
For the broader site-selection sequence, see the retail site-selection guide. For the method of combining multiple layers into a business decision, see the location analytics platform guide.
What is a practical retail location scorecard?
A scorecard makes trade-offs visible without pretending that every concept has the same weighting. Use the following 100-point starting framework, then change the weights to match the business model.
| Factor | Weight | What to test |
|---|---|---|
| Customer and demographic fit | 25 | Do the people in the reachable area match the offer and price point? |
| Daypart and activity fit | 25 | Does useful activity occur when the store will trade? |
| Catchment and access | 20 | Can priority customers reach the site without major barriers? |
| Competitor and anchor context | 15 | Does the surrounding cluster support discovery or intensify direct pressure? |
| Evidence quality and comparability | 15 | Are the sources current, clearly defined, and comparable with other sites? |
Imagine two candidate units with similar asking rents. Unit A has the higher area-level activity score, but most of its peak occurs outside the proposed opening hours and its catchment is split by a rail line. Unit B has a lower headline score, but stronger customer fit, better lunchtime activity, simpler access, and a complementary anchor nearby. If Unit A scores 21/25 for activity but 12/20 for access, while Unit B scores 18/25 and 18/20, the framework exposes why “more footfall” is not enough to settle the decision.
The numbers above are illustrative, not a universal investment rule. Use them to force a comparable conversation, then test the high-impact assumptions with a visit, direct count, landlord evidence, or a more specific dataset.
How can Locus support the workflow?
Locus connects the free map task to the evidence needed for a site decision. A team can inspect a candidate address, view catchment rings, compare nearby businesses, review demographic context, and examine activity patterns where data is available. Research users can then use the location workflow for comparison, heatmaps, travel-time overlays, and AI interpretation, with plan and data-availability limits kept visible.
Instead of saving a different spreadsheet for every address, a retail or franchise team can ask the same questions of each site: who can reach it, what activity exists, when does it happen, who else captures that demand, and which assumptions still need validation? Start with the Locus site-analysis workflow when an address is ready for a fuller evidence review.
What are the limits of retail foot traffic data?
No traffic source removes the need for judgement. Mobile and venue-based signals can have coverage, sampling, privacy, or geographic limitations. Sensors may count entrances accurately but say little about customer mix. Manual counts can be useful for a short validation window but are hard to compare across dates and locations. Landlord or centre counts may use definitions that differ from yours.
Use the source with the smallest uncertainty that the decision requires. If you need to know whether a lunchtime pattern exists across several areas, a relative activity signal may be enough for screening. If the final decision depends on a precise entry forecast, pair the screening evidence with direct observation and commercial diligence.
The bottom line
Foot traffic analysis for retail is strongest when it connects activity to a specific customer, trading window, catchment, and site decision. Compare the signal’s definition and time pattern, layer it with demographics, access, and competitors, and record uncertainty before a promising map becomes a costly commitment.
Sources and limitations
- BestTime.app provides the hourly popularity and busyness context referenced in this guide. Those patterns are relative signals and should not be read as an exact pedestrian census.
- ONS Census provides UK population and demographic context that can be layered with activity evidence. US analyses may use the U.S. Census Bureau American Community Survey.
- The Information Commissioner's Office anonymisation guidance explains why privacy and aggregation matter when interpreting location data.
- The Aislelabs retail foot-traffic guide and SafeGraph provider guide were reviewed for the measurement-method and privacy comparisons above; they are not data sources for the illustrative scorecard.
Keep reading
Related guides from the Locus library.
AI-Powered Location Intelligence for Local Business Growth
How Locus brings competitor mapping, demographics, foot traffic, catchment analysis, local reputation tracking, and AI recommendations into one practical workflow.
How AI is Revolutionizing Location Intelligence for Businesses
Discover how artificial intelligence is transforming business location decisions. Learn about AI-powered site selection, predictive analytics, and automated insights.