
Chicago Specialty Coffee Site Selection: Five Neighborhoods Compared
Sara
Head of Growth
Where should a specialty coffee shop open in Chicago? It is the place where customer, daypart, access, competition and commercial proposition fit well enough to justify the next round of fieldwork.
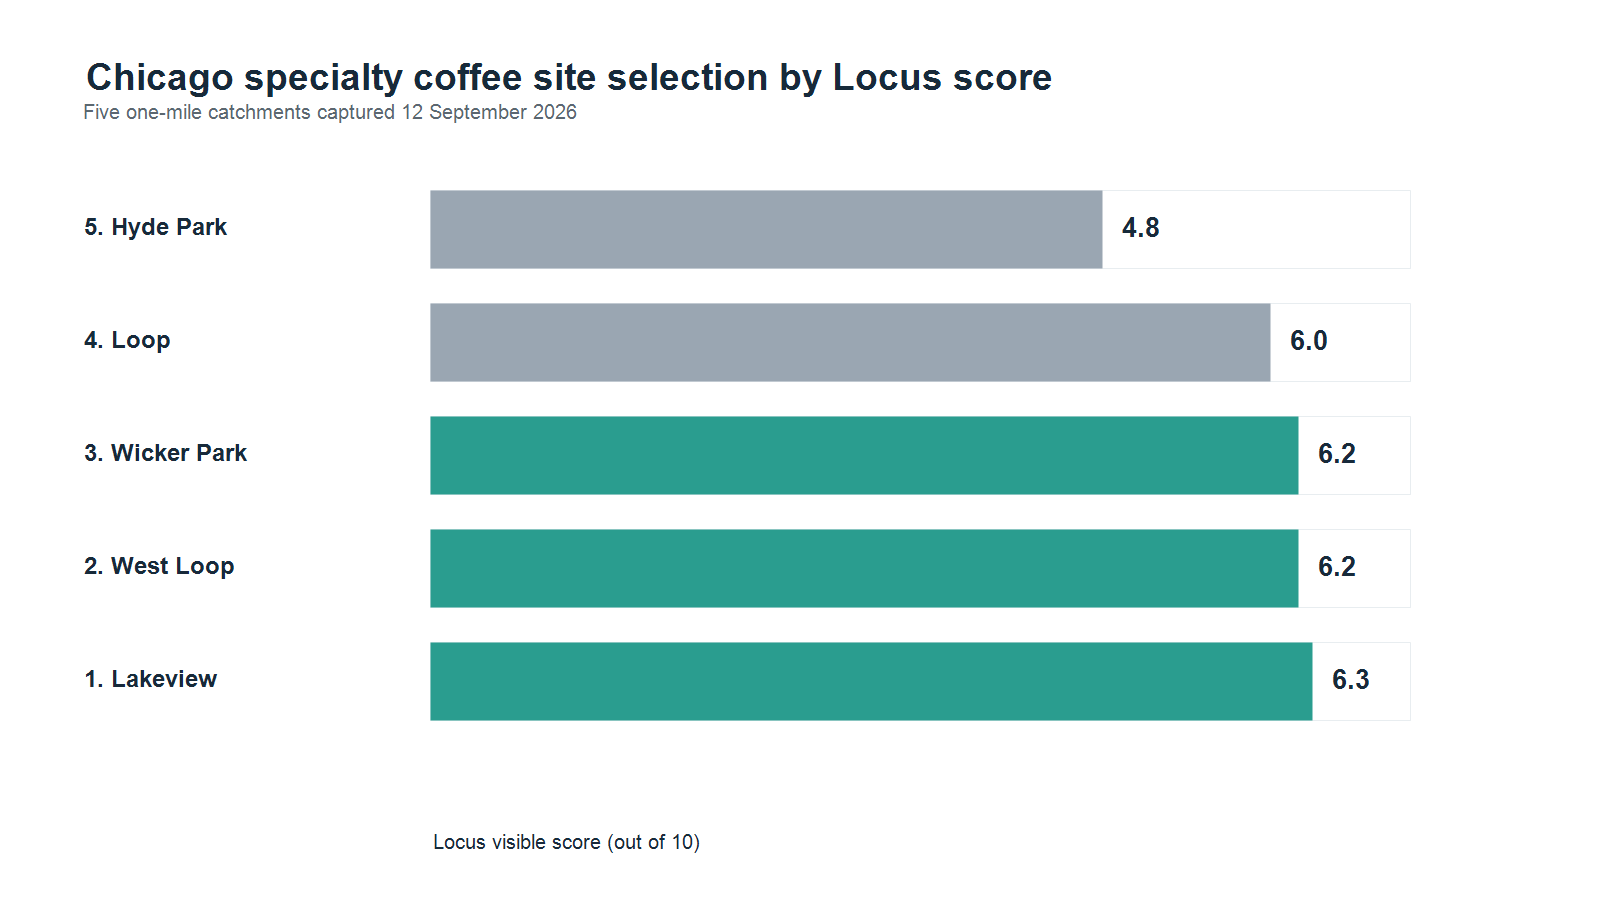
To make that decision concrete, I ran a Locus screen across five Chicago candidate points: the Loop, West Loop, Wicker Park, Hyde Park and Lakeview. Each point used the same specialty-coffee focus and a one-mile catchment. The headline result is more useful than a simple winner: Lakeview led at 6.3/10, but West Loop and Wicker Park were only 0.1 points behind. The screen therefore identifies a short list, not a lease decision.
The method
The study recorded the values visible in an authenticated Locus map workflow on 12 September 2026. The business focus was Specialty coffee Café, and the same one-mile catchment was applied to each selected point. Locus displayed demographic indicators, property-price context, accessibility, demand signals, nearby points of interest, a direct-competitor table and a 1–10 location assessment.
The comparison uses the visible Locus score as a screening aid. It combines evidence across demographics, accessibility, demand, competition and market-momentum signals; it does not forecast revenue, measure pedestrian footfall, rank vacant units or recommend a lease. Competitor discovery and profile metrics were surfaced by Locus from Google Places-backed data; the underlying provider payload was not independently refetched for this article. Distances are the displayed access distances, not guaranteed walking times.
The wider market backdrop is resilient but uneven. The U.S. Census Bureau reported July 2026 retail and food-services sales of $763.6 billion, down 0.6% from June but up 5.0% year over year. The National Restaurant Association reported 59,200 eating-and-drinking-place jobs added in August, the largest monthly gain since January 2023. Neither source tells an operator which Chicago frontage will convert demand.
Lakeview leads, but not by enough to stop asking questions
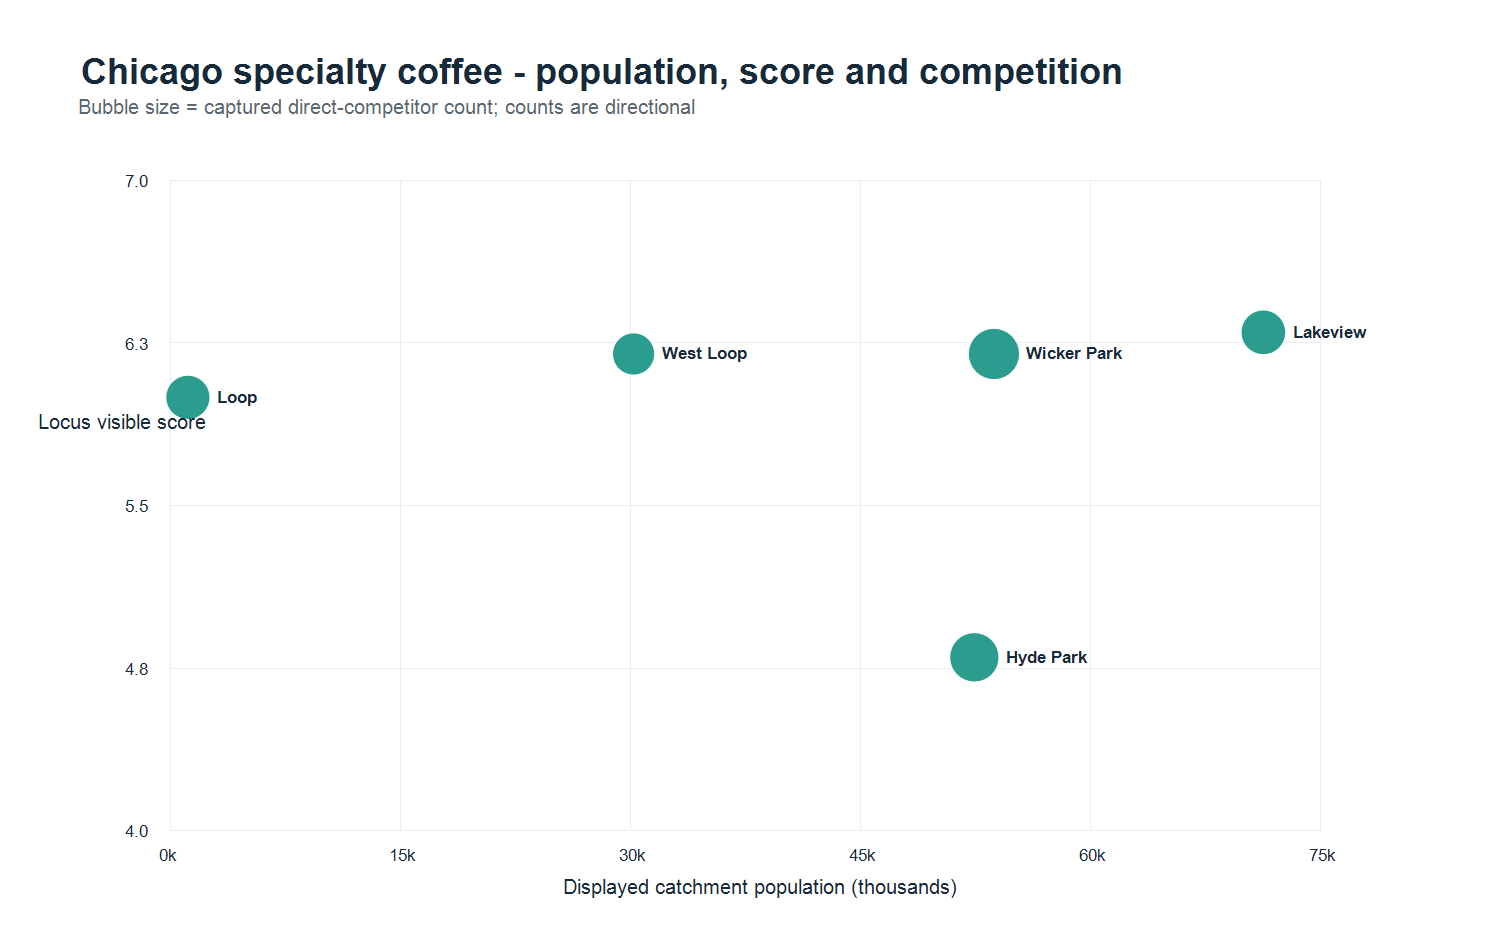
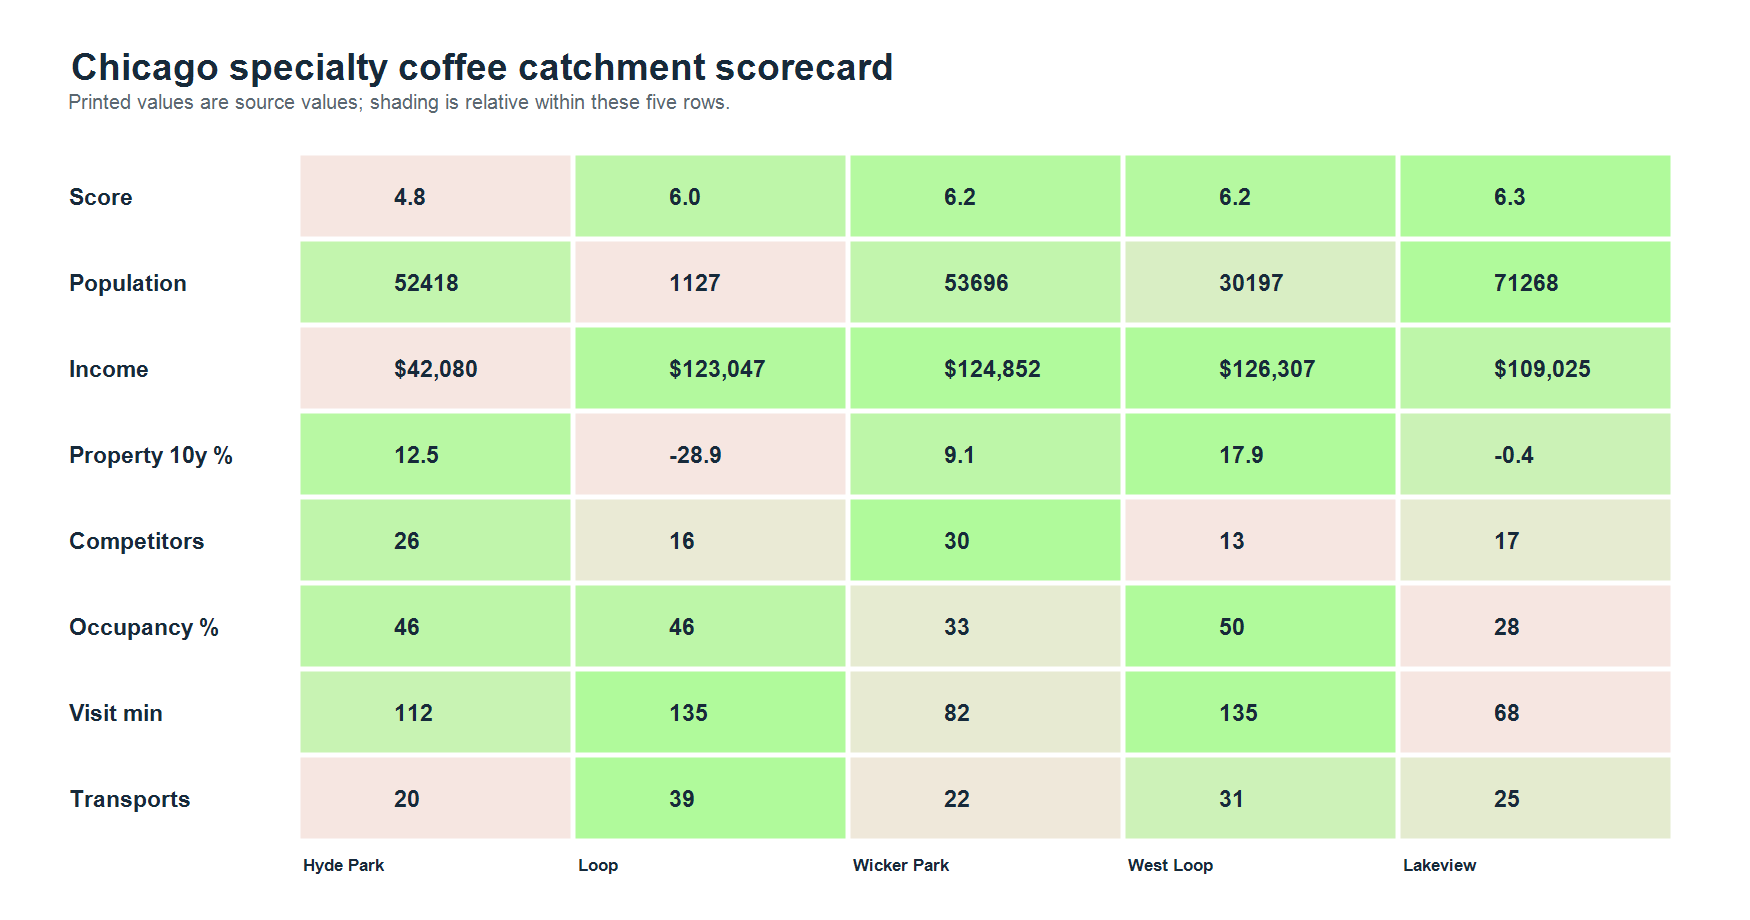
The 3000 N Broadway point in Lakeview received the highest visible score at 6.3/10. Its one-mile catchment showed 71,268 people, median household income of $109,025 and 25 transport locations. The demand panel showed weekends as 1.7 times busier, afternoon as the peak period, 28% average occupancy and a 68-minute average visit.
The strongest case for Lakeview is the combination of scale, affluence and a clear weekend customer pattern. The direct table displayed 17 competitors at an average rating of 4.7, including Owens Famous Coffee & Provisions, Kohi Coffee, AURA COFFEE & ROASTERY and Cafe Deko. The point had no train station in the displayed result and showed Belmont & Halsted as the nearest bus stop at 526 metres, so “good neighborhood” does not automatically mean “good corner.”
The Lakeview assessment is also a useful warning about data quality. Its broader summary repeated 36 reported businesses and an equal-share indication of about 1,980 people per operator, but the mixed result layer included Wrigley Field, a hospital, retailers and entertainment venues. The direct table showed 17 and an equal-share indication of 4,192 people per business. Neither figure is measured market share; the difference is a reason to recategorise the competitive set before using it in a model.
West Loop offers the strongest observed dwell signal
West Loop, screened around 1000 W Fulton Market, scored 6.2/10. Its catchment was smaller at 30,197 people, but median household income was $126,307. The panel showed weekends as 1.8 times busier, 50% afternoon occupancy and a 135-minute average visit—the strongest occupancy and longest dwell combination in the five-point set.
Thirteen direct competitors appeared in the captured table at an average rating of 4.6. Discourse Coffee was only 62 metres from the point; Sawada Coffee, Loop Coffee and Move Along Coffee represented different versions of the nearby specialty offer. The area also showed 31 transport locations and nearby Fulton Market, Whole Foods and Union Station context. The trade-off is commercial intensity: property median was $688,000 and the ten-year property index was up 17.9%.
West Loop looks like the best candidate for a concept that can monetise longer visits, food attachment or premium experience. It needs a stronger commercial model than a headline population figure alone would imply.
Wicker Park has scale and Saturday energy, with more visible supply
Wicker Park, around 1411 N Damen Avenue, also scored 6.2/10. The catchment showed 53,696 people, median income of $124,852 and density of 8,293 per square kilometre. Its demand pattern was weekend-led at 1.7 times busier, with a 33% afternoon occupancy signal and an 82-minute average visit.
The direct table displayed 30 competitors at an average rating of 4.5. The visible weekly pattern was particularly strong on Saturday, at 43% of the displayed day signal, with Friday at 31% and Thursday at 26%. The set included The Wormhole Coffee, Prequel Cafe-Wicker Park, Engine Coffee and Arwa Yemeni Coffee. This is a credible neighborhood-café environment, but it also means the entrant has to explain why its specialty proposition deserves a separate visit.
Wicker Park has a different opportunity from West Loop. The evidence points to neighborhood identity and Saturday demand rather than the longest dwell. The property median was $731,000, so the location needs a clear customer and pricing thesis before site economics are tested.
The Loop shows why access is not the same as resident demand
The Loop point, screened around LaSalle Street, scored 6.0/10. It had the highest transport count at 39, the strongest morning occupancy signal at 46% and a weekday peak of 1.6 times busier. Willis Tower, Ogilvie, Block 37, Union Station and DePaul Loop created a compelling commuter and visitor context.
But the displayed one-mile population was only 1,127. The direct table showed 16 competitors at an average rating of 4.6, producing an equal-share indication of only 70 people per business. The broader result layer also included retailers, hotels, a theatre, a plaza and a professional-services office. That does not make the Loop unusable; it changes the question. A Loop café would need to monetise commuter, office, visitor and event patterns rather than assume a large resident base.
Hyde Park is cheaper on property, weaker on purchasing-power evidence
Hyde Park, around 5500 S Lake Park Avenue, scored 4.8/10. Its catchment showed 52,418 people, but median household income was $42,080. The panel showed 20 transport locations, the 55th–56th–57th station 225 metres away, 46% afternoon occupancy and a 112-minute average visit. Its median property price was the lowest of the five at $289,000.
The visible competitor table showed 26 businesses at a 4.1 average rating, including Sip&Savor, TrueNorth, Philz and Ex Libris. The combination of a lower property median and nearby anchors is worth investigating for the right concept, but the screen does not support treating lower real-estate cost as a substitute for customer spending power. No bus stop was found in the captured access panel, another reason to validate the exact frontage rather than generalize from the neighborhood.
What operators should do next
Shortlist Lakeview, West Loop and Wicker Park for site-level validation, but give each a different fieldwork brief. In Lakeview, test Belmont-area visibility, weekend conversion and the gap between established high-rated operators. In West Loop, test weekday office movement, afternoon dwell and whether rent can be supported by premium food or experience. In Wicker Park, test Saturday demand, repeat local use and the defensibility of a distinct specialty offer.
For the Loop, count commuter and visitor flows by daypart rather than relying on resident population. For Hyde Park, validate price sensitivity, transit-to-frontage movement and whether a lower property basis actually translates into an attractive operating model.
Across all five, verify the exact unit: rent, service charge, frontage, sightlines, use permissions, ventilation, seating rights, opening hours, delivery access and nearby competitor pricing. The displayed 3.6K search volume and 99.2% three-year trend are broad Chicago café signals, not proof of specialty-coffee demand at any one address.
The practical conclusion is a narrow one: Lakeview is the best first candidate in this screen, while West Loop and Wicker Park are close enough that the winning choice depends on format and frontage. The score makes the shortlist easier to explain; fieldwork and unit economics decide whether any point deserves a lease.
All analysis was run in Locus, which brings demographics, catchment context, competitor mapping, accessibility and demand signals into one location-decision workflow. Run your own location study free at locusintel.io →
Sources
- U.S. Census Bureau Monthly Retail Trade, checked 12 September 2026 for July 2026 retail and food-services sales context.
- National Restaurant Association Economic Insights, checked 12 September 2026 for August 2026 eating-and-drinking-place employment context.
- Locus map workflow, authenticated study capture used for the five catchments, 12 September 2026.
Keep reading
Related guides from the Locus library.
AI-Powered Location Intelligence for Local Business Growth
How Locus brings competitor mapping, demographics, foot traffic, catchment analysis, local reputation tracking, and AI recommendations into one practical workflow.
How AI is Revolutionizing Location Intelligence for Businesses
Discover how artificial intelligence is transforming business location decisions. Learn about AI-powered site selection, predictive analytics, and automated insights.