
UK High Street Opportunity Index: The Evidence Gate
We tested 9,623 UK retail centres and a four-nation coffee pilot to learn what must be proved before a high street ranking is fair.
Adam
Marketing Manager
High street rankings are easy to publish. Fair ones are harder.
A table can look authoritative while quietly mixing incompatible boundaries, different census years and incomplete points of interest. The result may be neat enough for a headline, but weak enough to send an expansion team in the wrong direction.
Locus is building a UK High Street Opportunity Index. Before publishing a national league table, we tested whether the underlying data could support one. The first result is clear: the source foundation is strong enough for a controlled, four-nation coffee-shop pilot. The wider UK ranking is not ready yet.
That is worth publishing. Knowing when a model should stop is part of good location analysis.
What we tested
We started with GeoDS Retail Centre Boundaries v4.0, which gives us a current national universe of 9,623 retail centres: 8,116 in England, 811 in Scotland, 459 in Wales and 237 in Northern Ireland.
Retail parks and shopping-centre-only classes were removed from the headline high street screen. That left 8,404 candidate centres before later quality checks.
For demographics, we used GeoDS Unified UK Census Data 2021/2. The audited files contain 25 topic tables, 239,023 small areas and 215 variables including totals. The layer covers all four UK nations, but it is not perfectly uniform: Scotland's census data is from 2022, while England, Wales and Northern Ireland use 2021 data. Some definitions also vary by nation.
For the business category, we used an open Overture Maps Places extract from the 22 July 2026 release. After filtering for UK coffee and cafe categories and records marked open or without an operating status, the extract contained 58,055 candidates inside the UK bounding box. We then filtered those records to the official retail-centre geometries.
We also reviewed Nomis UK Business Counts as a possible cross-check. It was not added to the score because its geography is not yet comparable with retail-centre catchments and Northern Ireland needs explicit treatment.
The pilot covered all four nations
The evidence sample contains 20 town centres, with five manually checked centres in each UK nation.
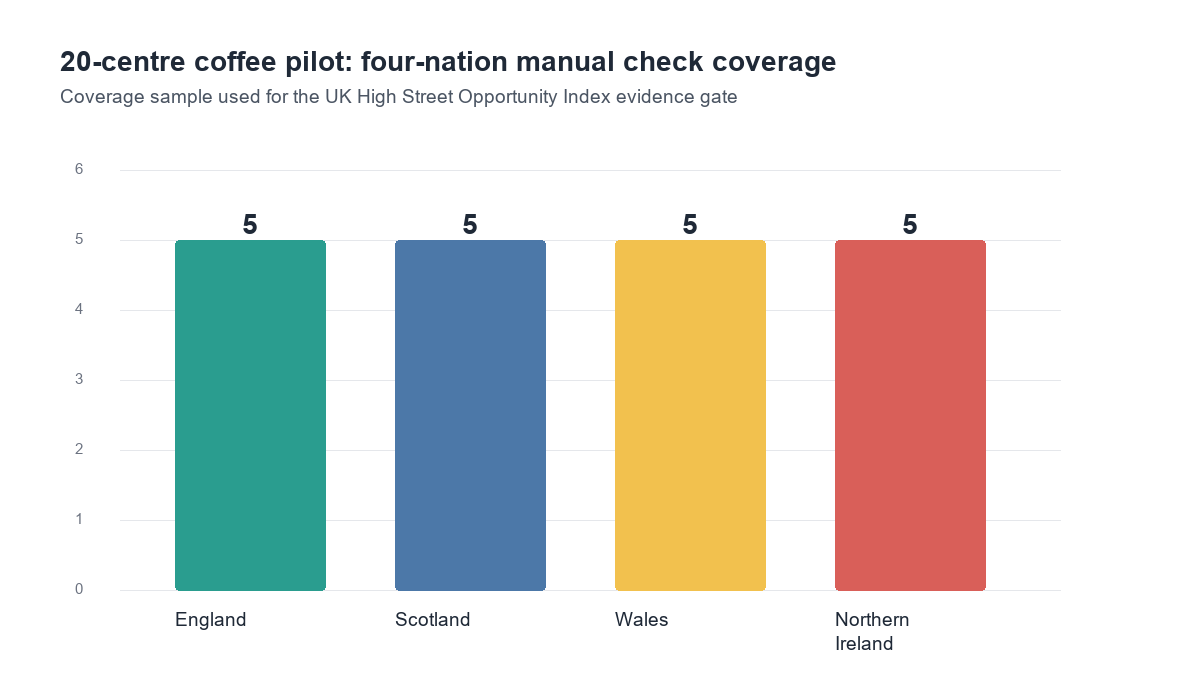
Every centre ID was present and unique. Each row had a validated coffee or cafe category flag, and all 20 manual checks passed.
This balance is deliberate. It tests whether the same method can run across four national data systems. It does not create a statistically representative shortlist of every UK high street.
How the coffee pilot was scored
The pilot compares centres inside one peer group: town centres. It does not mix town centres with retail parks, regional centres or small local centres.
The base score has four components:
- Demand potential (35%): population, working-age share and relevant household and employment indicators.
- Competitive headroom (30%): catchment population per coffee or cafe point of interest.
- Accessibility (20%): no-car household share as a walking and public-transport proxy.
- Market resilience (15%): employment and professional or managerial mix indicators.
Each component was converted to a percentile rank within the pilot peer group before weighting. This prevents a large raw value in one field from overwhelming the rest of the score.
These are screening weights. They do not account for a specific unit's rent, frontage, planning status, visibility or condition.
What the pilot found
Brixton had the highest base score in the 20-centre sample at 98.4. Crewe and Gateshead followed. The full pilot top ten was:
- Brixton, England: 98.4
- Crewe, England: 77.1
- Gateshead, England: 73.9
- Cambridge, England: 65.3
- Dunfermline, Scotland: 63.7
- Merthyr Tydfil, Wales: 62.6
- Bridgend, Wales: 62.4
- Ballymena, Northern Ireland: 57.6
- Dumfries, Scotland: 52.1
- Cirencester, England: 50.5
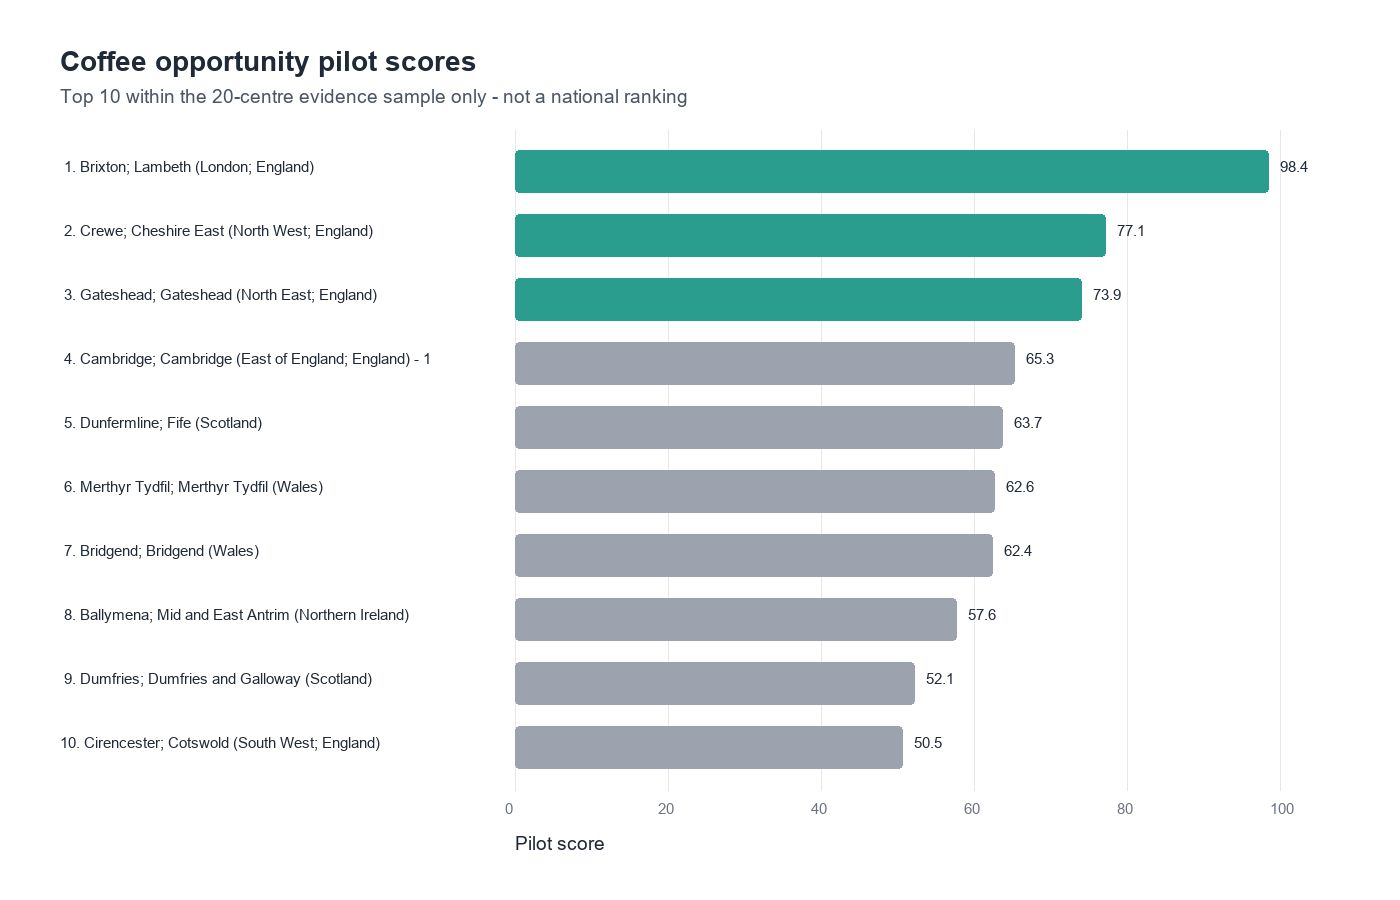
This is not a list of the UK's best places to open a coffee shop. The sample was balanced by nation to test the method, not selected as a final national shortlist. Brixton's result means the model behaved strongly for Brixton inside this evidence sample. It is not permission to sign a lease.
The sensitivity test passed
We reran the pilot with demand-led, competitive-headroom-led, accessibility-led and resilience-led weights. No centre moved by more than 10 score points. The largest movement was 8.2 points, and the largest rank shift was three places.
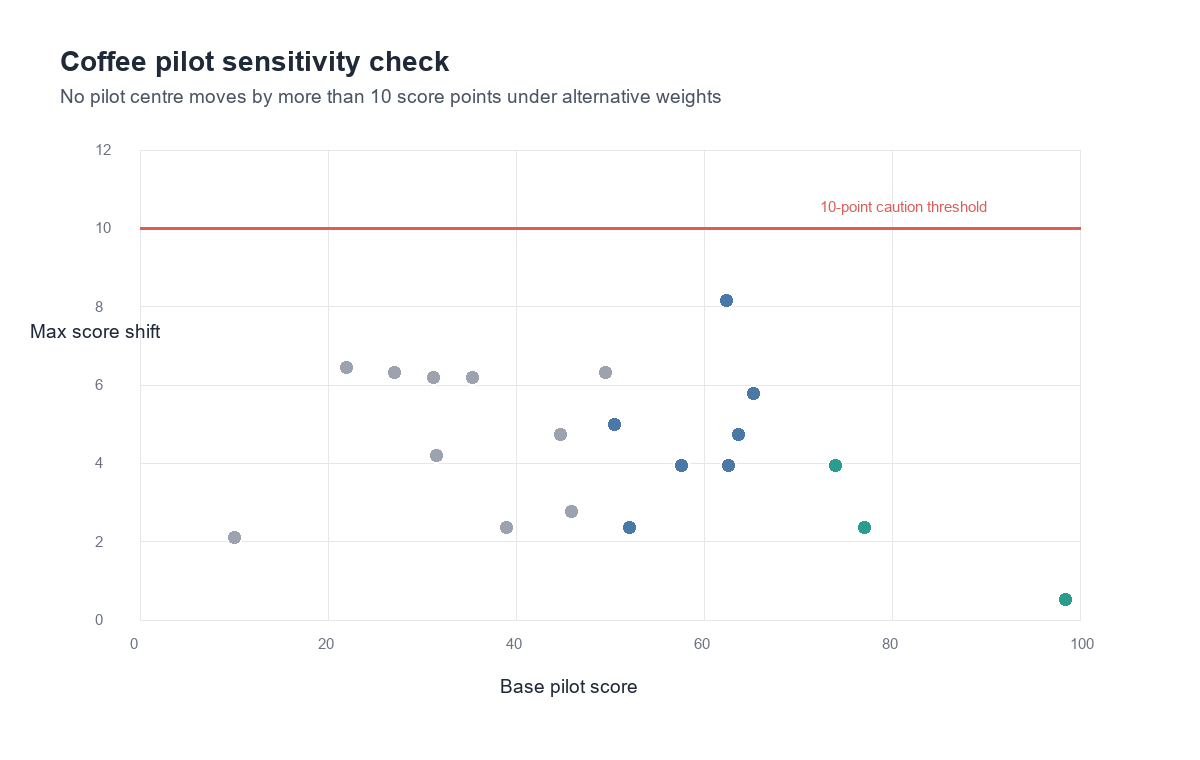
That is stable enough to continue testing the component. It does not rescue the wider ranking.
Why the national ranking is still held
The scaled feature build now covers 274 town centres with census-linked catchments and no empty catchments. All four nations are present. Two problems remain.
First, the scaled top ten was England-only. That may reflect real conditions, but it may also reflect peer-group composition, source differences or uneven evidence. We need to separate those explanations before attaching a national claim.
Second, the winning centre changed under an accessibility-heavy weighting. A public ranking should not produce a confident winner that depends on one reasonable change to the model.
We also rejected a tempting shortcut: joining older GeoDS indicator tables directly to v4.0 retail-centre IDs. Without a validated crosswalk, matching those identifiers would create false precision.
So the national table stays unpublished. The pilot has earned another stage of work, not a bigger headline.
What this means for expansion teams
An opportunity index should narrow the search, not make the final property decision.
For a coffee operator or franchise team, the useful workflow is:
- Define the retail-centre universe and business category.
- Compare like-for-like centres within a peer group.
- Test whether the shortlist survives reasonable weighting changes.
- Investigate individual units using current local evidence.
The fourth step still needs catchment demand, direct competitors, access, footfall, rent, frontage and planning constraints. Brand format matters too. A kiosk, neighbourhood cafe and drive-through should not share one location model.
The next release will focus on stronger peer groups and national sensitivity checks. Until those pass, we will keep calling this what it is: a reproducible coffee opportunity component, not a UK ranking.
Screening a market is the start. To assess a real candidate unit, request a free Locus site check.
Sources and licensing
- GeoDS Retail Centre Boundaries v4.0, used under the UK Open Government Licence with GeoDS and source attribution.
- GeoDS Unified UK Census Data 2021/2, containing harmonised data from ONS, NRS and NISRA under the stated source terms.
- Overture Maps Places and Overture attribution guidance. Contributor terms vary by source, including Apache 2.0 for Foursquare-derived records and CC0 1.0 for AllThePlaces records.
- Nomis UK Business Counts, reviewed as a cross-check but not included in the pilot score.
Keep reading
Related guides from the Locus library.
AI-Powered Location Intelligence for Local Business Growth
How Locus brings competitor mapping, demographics, foot traffic, catchment analysis, local reputation tracking, and AI recommendations into one practical workflow.
How AI is Revolutionizing Location Intelligence for Businesses
Discover how artificial intelligence is transforming business location decisions. Learn about AI-powered site selection, predictive analytics, and automated insights.