

When ZIP-Like Census Areas Reverse Local Income Rankings
A Franklin County audit shows how geographic units and uncertainty change resident-income comparisons before site diligence.
Locus Team
Location research
Hero: AI-generated editorial illustration; it does not depict a studied premises.
A location shortlist can change when its demographic unit changes. A local census tract and a ZIP-like Census area describe different populations, even when both appear in a report about the same neighbourhood.
For an expansion team, property advisor or café operator comparing areas, the useful question is how much that choice can change an income comparison—and whether the result survives reasonable checks on uncertainty and boundaries.
We audited the 328 census tracts represented for Franklin County, Ohio, in the official 2020 Census tract-to-ZCTA relationship file. Of those, 326 had usable median household income estimates at both comparison levels. Across 51,547 eligible tract pairs linked to different ZIP Code Tabulation Areas (ZCTAs), the income ordering reversed in 11,933 pairs, or 23.1%.
That headline percentage needs context. Requiring non-overlapping published estimate-plus-or-minus-margin-of-error intervals at both levels left 22,662 pairs; 1,690 of those reversed, or 7.5%. With a stricter boundary-association screen, the corresponding result was 398 of 8,840 pairs, or 4.5%. The denominators differ because each screen asks a more restricted question.
Why this is more than a larger-area population count
The Census Bureau’s ZCTA guidance explains that ZCTAs are generalized areal representations of ZIP Codes. They are useful analytical areas, but they are not identical to postal delivery ZIP Codes or customer trade areas.
Larger areas will often contain more residents. That alone is a weak reason to change a site decision. Median household income is a different test: replacing the local tract estimate with a broader-area median can change which of two candidate contexts appears higher-income. Neither median is a prediction of spending at a particular business.
This study measures that substitution under a declared crosswalk convention. It does not discover a new statistical phenomenon. Its contribution is a reproducible county-level audit, with the numerator, denominator, uncertainty filter and boundary assumptions exposed so an analyst can challenge the comparison before using it.
The county audit and its association rule
We used the official 2020 ZCTA-to-tract relationship file. Each record describes a geographic intersection; Census documentation explicitly says these are geography relationships.
For every tract with Franklin County prefix 39049, we selected the ZCTA with the largest positive land intersection. Ties would be broken by ZCTA identifier. We then joined the tract and ZCTA directly to their published 2020–2024 ACS five-year median household income estimates and margins of error in table B19013. We did not average tract medians or infer ZCTA income from tract records.
The eligible sample contains 326 tracts associated with 42 ZCTAs. Two tract estimates were unavailable and excluded: 39049001121 and 39049980000. A ZCTA associated with a county tract may extend beyond the county. Largest land overlap is an explicit association rule, not proof that most households, businesses or visitors lie in that ZCTA. An address-level site analysis should use the actual point and relevant boundaries.
The eligible tracts' selected land shares range from 39.4% to 100%, with a median of 100%; 176 of 326 are wholly within their associated ZCTA by land area. Five have a largest intersection below 50%, so largest overlap can mean a plurality rather than a majority. Twelve of the 42 associated ZCTAs extend by land outside Franklin County; their ACS medians describe the entire ZCTA.
What changes when the test becomes stricter
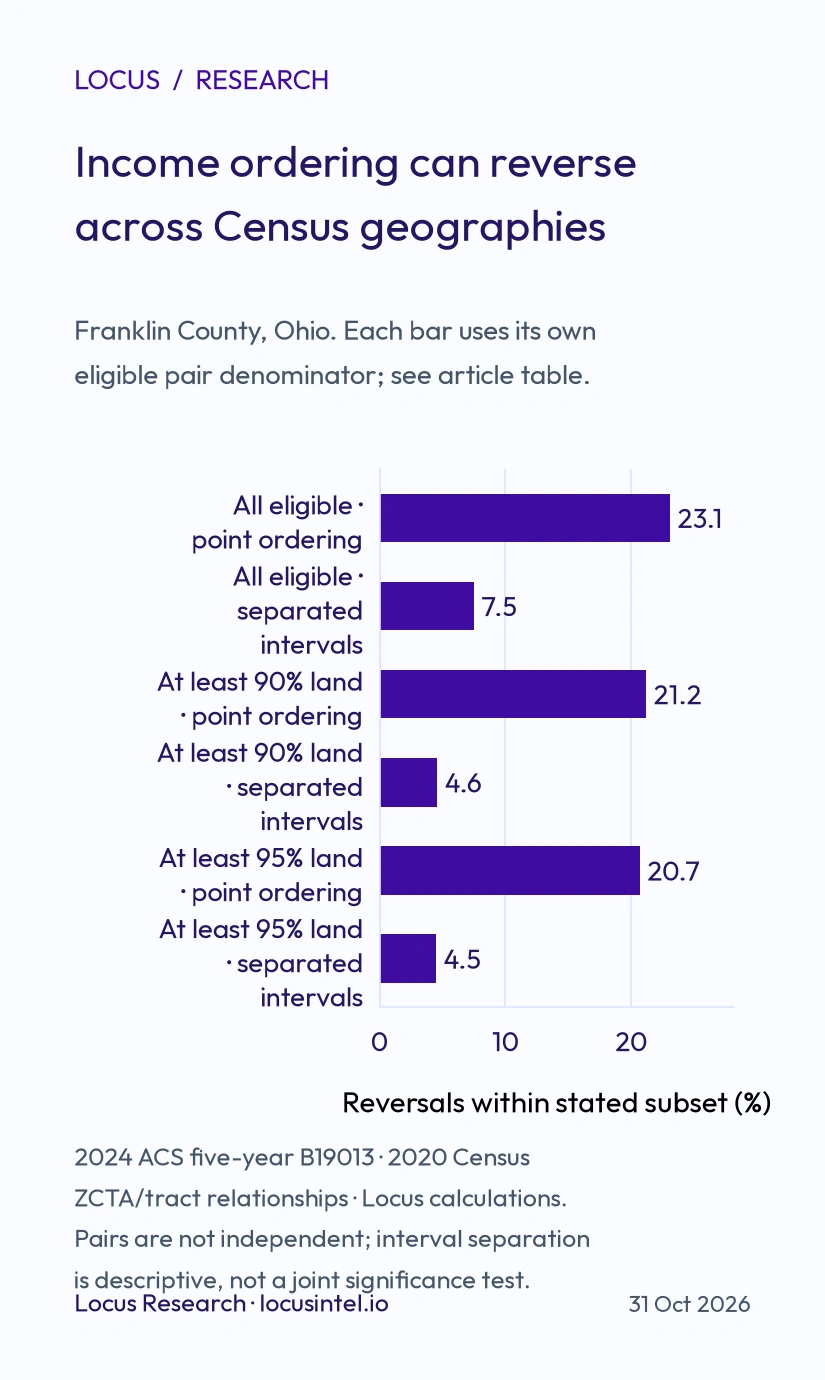
Source: U.S. Census Bureau 2024 ACS five-year B19013 and 2020 ZCTA/tract relationship file; Locus calculations. Each percentage uses its own stated pair denominator. Pairs share tracts and ZCTAs and are not independent observations.
All eligible land associations
| Measure | Result |
|---|---|
| Eligible tracts | 326 |
| Cross-ZCTA pairs | 51,547 |
| Point reversals | 11,933 of 51,547 (23.1%) |
| Separated pairs | 22,662 |
| Separated reversals | 1,690 of 22,662 (7.5%) |
At least 90% of tract land in the associated ZCTA
| Measure | Result |
|---|---|
| Eligible tracts | 224 |
| Cross-ZCTA pairs | 24,286 |
| Point reversals | 5,138 of 24,286 (21.2%) |
| Separated pairs | 10,619 |
| Separated reversals | 493 of 10,619 (4.6%) |
At least 95% of tract land in the associated ZCTA
| Measure | Result |
|---|---|
| Eligible tracts | 204 |
| Cross-ZCTA pairs | 20,124 |
| Point reversals | 4,157 of 20,124 (20.7%) |
| Separated pairs | 8,840 |
| Separated reversals | 398 of 8,840 (4.5%) |
A reversal requires a strict change in ordering: tract A higher than tract B, but associated ZCTA A lower than ZCTA B, or the reverse. Pairs sharing a ZCTA are excluded because substituting the same ZCTA produces a tie. There were no remaining point-estimate ties among eligible distinct-ZCTA pairs.
There are 52,975 unordered pairs among the 326 eligible tracts; 1,428 same-ZCTA pairs are excluded, leaving 51,547. Of the 11,933 point reversals, 1,690 survive both interval screens (14.2%); the remaining 10,243 are unresolved by that screen, not demonstrated false. The 1,690 surviving reversals are 3.3% of all 51,547 cross-ZCTA pairs. This common-denominator view complements the 7.5% conditional rate.
The interval screen compares estimate minus published MOE with estimate plus MOE for each geography. Published ACS MOEs use a 90% confidence level; this differs from the 90% and 95% land-overlap thresholds, which describe physical area coverage. The screen keeps only pairs whose intervals do not overlap at tract level and also do not overlap at ZCTA level. This descriptive filter is deliberately stricter than comparing point estimates alone. It is not a formal joint significance test and does not estimate covariance. The Census statistical testing guidance explains why higher or lower point estimates alone cannot establish a statistically significant difference.
The sensitivity checks change the result materially. A reader should therefore keep the 23.1%, 7.5% and 4.5% results attached to their respective eligibility rules rather than quote the largest number as the chance a business will choose the wrong site.
Does repeating the same ZIP-like area drive the finding?
Some ZCTAs contain more eligible tracts, so counting every tract pair gives those areas more weight. In an additional exploratory check, we first computed the reversal fraction within each distinct ZCTA pair, then averaged those fractions with equal weight for each ZCTA pair. This check was added after the initial county results to address repetition rather than to replace the main calculation.
Across 861 distinct ZCTA pairs, the equally weighted point-estimate result was 23.7%, compared with 23.1% for all tract pairs. For separated intervals, 645 ZCTA-pair groups had eligible comparisons and the equally weighted result was 9.3%, compared with 7.5%. Within the 95% land-overlap subset, the equally weighted results were 20.9% across 741 groups and 7.9% across 544 separated groups. These differences show why both the geography rule and weighting convention belong beside the finding.
How this should change a location brief
Before comparing candidate areas, record the geography identifier, data vintage, measure and margin of error. If one report describes a local tract while another supplies a ZCTA median, treat the substitution as a different comparison requiring explanation.
For a two-area shortlist, test both geographic views and ask whether the higher-income context changes. If it does, inspect the actual catchment, address-to-boundary relationship and intended customer base. If intervals overlap, report the ordering as uncertain rather than presenting a confident winner. Even a stable ranking leaves commercial questions unanswered: access, available premises, competition, daytime activity, customer behaviour, rent and operating costs need their own evidence.
Locus’s site analysis workflow provides a starting point for assembling location evidence. The geographic unit and source limitations should remain visible in the comparison, whichever workflow supplies the evidence.
Reproduction, limits and study design
This county extension is exploratory. It followed an initial two-address Columbus demonstration; the county sample, largest-land-overlap rule, exclusion criteria and 90%/95% sensitivity checks were written down before inspecting the expanded results. The earlier demonstration remains a worked example, not evidence of county-wide frequency.
The reproduction package contains the Census crosswalk and income file, tract-level associations, all eligible pairs, exclusions, calculation code, results and source hashes. The pair count is combinatorial: the same tract participates in many pairs, and many tracts share a ZCTA. The percentages describe this specific audit, not independent trials, a representative sample of available commercial sites, or a market-wide error probability.
The 2020 geographic relationship file and 2020–2024 ACS estimates have different reference roles. Boundary association uses the 2020 file; income uses the published five-year estimates, in 2024 inflation-adjusted dollars. No time trend is inferred. The analysis covers Franklin County tract contexts and their associated ZCTAs; it does not claim all Columbus metro counties, other markets, café customers or product coverage.
Data attribution: U.S. Census Bureau, 2024 ACS five-year documentation, B19013 table file, 2020 ZCTA/tract relationship file, and ACS accuracy documentation. Locus performed the association and comparison calculations. Census does not endorse this analysis.
Keep reading
Related guides from the Locus library.
AI-Powered Location Intelligence for Local Business Growth
How Locus brings competitor mapping, demographics, foot traffic, catchment analysis, local reputation tracking, and AI recommendations into one practical workflow.
How AI is Revolutionizing Location Intelligence for Businesses
Discover how artificial intelligence is transforming business location decisions. Learn about AI-powered site selection, predictive analytics, and automated insights.