

Manchester EV Charging Site Screening: Validate the Map Before the Site
A Locus screen around Manchester Piccadilly shows useful transport context but a competitor table that needs manual category validation before any charging-site decision.
Ahmed
Founder of Locus
Manchester is actively expanding its electric-vehicle infrastructure. Manchester City Council says it wants to make charging easier for residents without driveways, and its March 2026 lamppost pilot reported 38 live charging points across wards where residents had asked for more support or off-street parking was limited. The Department for Transport’s latest detailed quarterly release counted 121,171 public EV chargers across the UK as of 1 July 2026, including 28,887 rated rapid or above.
That context makes Manchester a sensible place to ask a practical site-selection question: what does a city-centre screen tell an operator before a proposed charging site is checked for power, access, land control and actual utilisation?
This study uses a Locus screen around M1 2AP near Manchester Piccadilly. The result is useful, but its most important lesson is methodological: a map result still needs category validation before its competitor count is treated as evidence.

What the M1 2AP screen displayed
The study used a 15-minute drive context for travel and a separate five-mile demographic radius. Those are different lenses. A demographic radius is not a forecast of charger demand, and a drive-time area is not a guaranteed service territory.
| Evidence | What Locus displayed | How to use it |
|---|---|---|
| Population in the five-mile radius | 795,897 | Broad local context, not a vehicle or charging-demand forecast |
| Population density | 5,375.7 people/km² | Dense urban setting around the anchor |
| Displayed median income | £32,226 | Compared with a displayed £31,400 national reference |
| Transport points | 28 | A prompt for access and interchange checks |
| Nearest rail station | Manchester Piccadilly, 464 m | Supports a rail-linked access hypothesis |
| Nearest bus stop | Piccadilly (Stop EO), 83 m | Supports a public-transport context, not charger utilisation |
| Direct competitors displayed | 37 | Requires category audit before use |
The screen therefore establishes a plausible urban access question, not a business case. It does not show grid capacity, charger power, pricing, uptime, parking constraints or lease economics.
The competitor count needs a second look
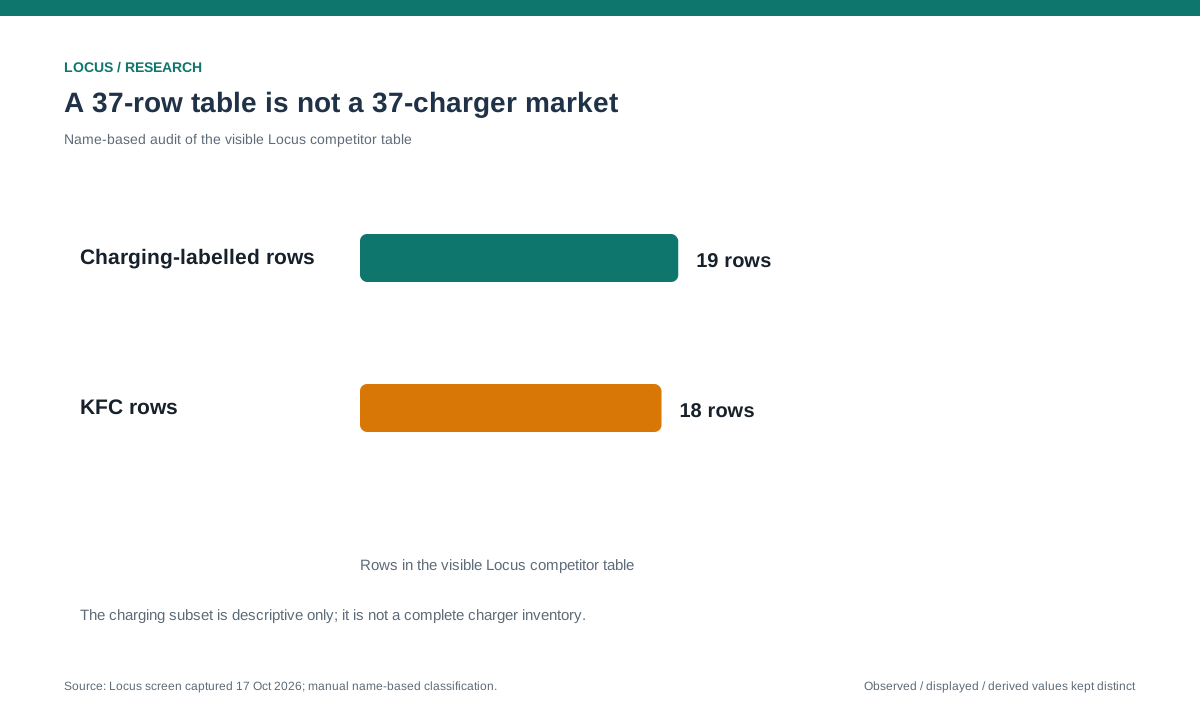
The product table returns 37 visible rows under its direct-competitor view. A manual name-based check found that 19 rows identify charging operators or charging stations, while 18 rows are KFC locations. The raw table is therefore not a clean EV-charging inventory, and the rows are not a count of unique competitors.
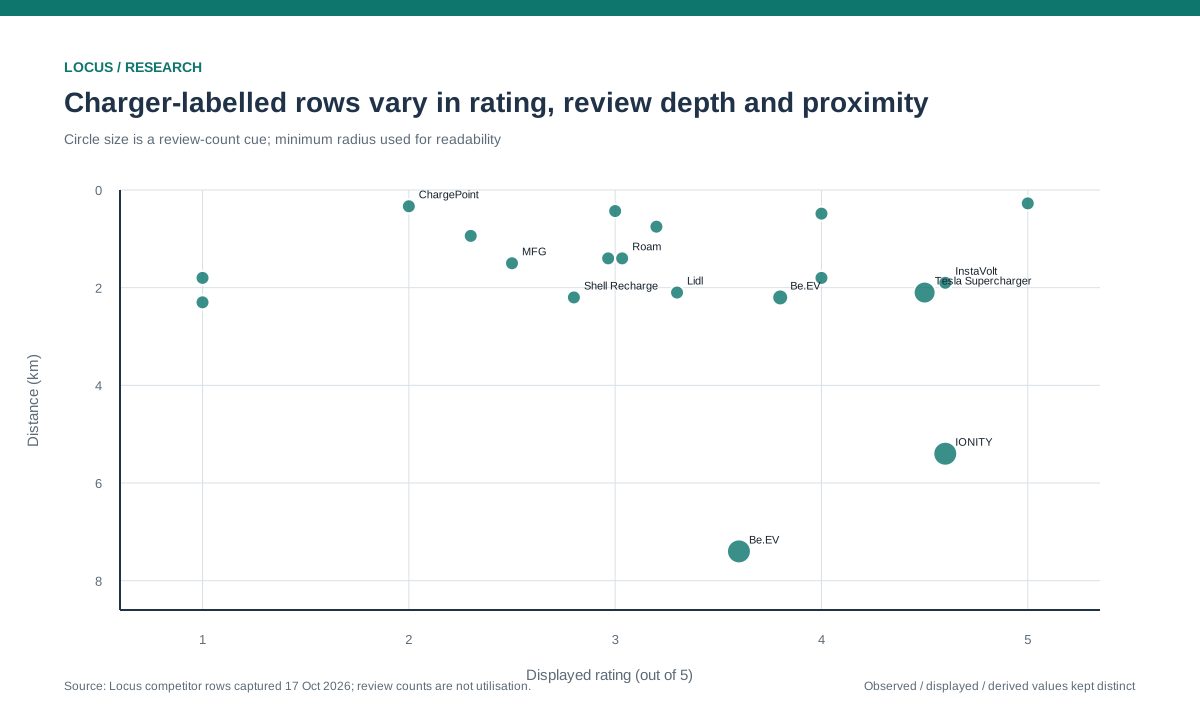
For the 19 charging-labelled rows, the displayed ratings average 3.22/5 without weighting, and the table contains 187 visible reviews in total. These are discovery signals only. They are not a service-quality index, customer volume, utilisation rate or market share. A charger with one review and a charger with 34 reviews should not be treated as equivalent operating evidence, and a highly rated listing does not prove that it has spare capacity.
The product also displayed online-demand tiles, but the visible screen did not expose their underlying source or calculation. Those tiles are deliberately excluded here. A large-looking search number without a dated, inspectable source is not enough to support a site decision.
The national context is useful—but not local proof
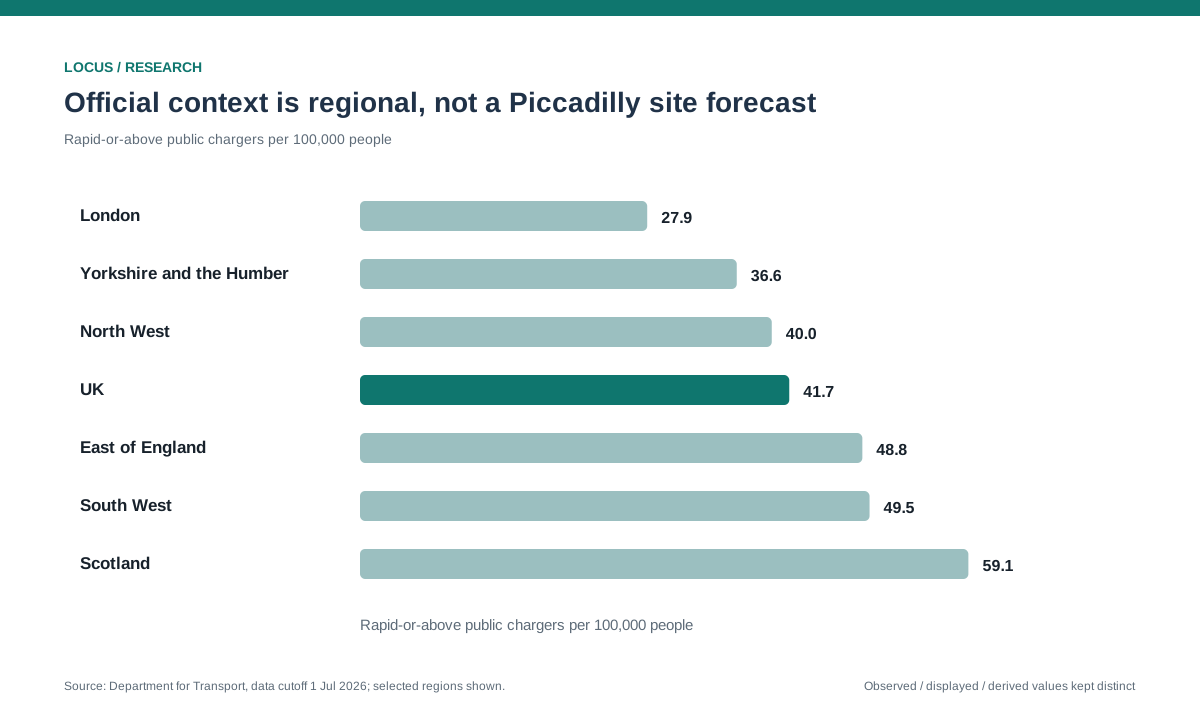
The DfT’s 1 July quarterly release gives a current national frame. The UK had 41.7 rapid-or-above public chargers per 100,000 people. The North West had 40.0, close to the UK figure, while London had 27.9 and Scotland 59.1. The same release says that charger provision varies by authority and that the official series is still classified as official statistics in development.
That comparison does not tell us how many chargers are available near Piccadilly, which operators are reliable, or whether a new site would capture a viable journey type. It does help define the next question: is a proposed site solving a local access gap, adding a destination option, or competing for en-route demand that is already well served?
Manchester’s own policy points in the same direction. The council’s current EV page invites suggested charge-point locations and links to its EV charging strategy. Its 2026 lamppost pilot selected locations partly because residents requested better infrastructure or had limited off-street parking. For a commercial operator, that is a reminder to separate two markets: residents who need dependable overnight or nearby charging, and drivers who need a fast top-up during a journey.
What an operator should validate next
The M1 2AP screen is best treated as a prioritisation brief. Before a site is advanced, validate four things:
- The category and inventory. Confirm each nearby charging listing, its exact location, operator, public access, connector mix and current status. Do not carry the raw “37 visible rows” number into a financial model.
- The journey type. Destination, on-street and en-route chargers solve different problems. A rail-adjacent urban site may serve commuters, residents, taxi drivers or short-stay visitors, but the screen alone cannot tell us which group dominates.
- The physical and commercial constraints. Check parking circulation, queueing, visibility, power availability, landlord control, planning requirements and the cost of the connection. None of these are supplied by the demographic radius.
- The measurement plan. Define what would count as evidence after opening: sessions, energy delivered, occupancy by hour, repeat use, dwell time, revenue per bay and maintenance downtime. Keep those measures separate from review counts and map proximity.
The defensible conclusion is narrow. Manchester has a current policy and infrastructure context for EV charging, and M1 2AP has a dense urban transport context in the Locus screen. But the raw competitor list is not ready to be used as a market-size input. The next decision is not “open here” or “do not open here”; it is whether the proposed site can pass a category, access, power and utilisation validation sequence.
Methodology and sources
Locus was run on 17 October 2026 for EV Charging Station with the niche public rapid charging, anchored at Piccadilly, Manchester, M1 2AP. The product displayed the demographic and access fields above. The competitor audit classified the 37 visible rows by the business name shown in the product table; charging-labelled rows were retained for the descriptive subset and KFC rows were excluded. This is not a complete charger inventory and does not verify whether each listing remains live or offers rapid charging. Age and household percentages in the displayed demographic breakdown may not sum to exactly 100% because of rounding.
External context comes from the Department for Transport’s 1 July 2026 public EV charging statistics, Manchester City Council’s EV information page, and the council’s March 2026 lamppost-charging pilot update. Official statistics are dated to their stated release cutoff; product values are labelled as displayed evidence. Generated imagery is illustrative and does not depict the measured site, a customer, a charger operator or a measured result.
Keep reading
Related guides from the Locus library.
AI-Powered Location Intelligence for Local Business Growth
How Locus brings competitor mapping, demographics, foot traffic, catchment analysis, local reputation tracking, and AI recommendations into one practical workflow.
How AI is Revolutionizing Location Intelligence for Businesses
Discover how artificial intelligence is transforming business location decisions. Learn about AI-powered site selection, predictive analytics, and automated insights.