
NYC Retail Site Screening: Why the Area Field Changes the Shortlist
A reproducible PLUTO study of 64,230 NYC tax lots shows how building, commercial and retail area filters change a retail research shortlist.
Adam
Marketing Manager
A retail brief asks for 1,000–3,000 square feet. An analyst opens a property dataset, finds an area column and applies the range. The resulting list can look precise while answering a different question from the brief.
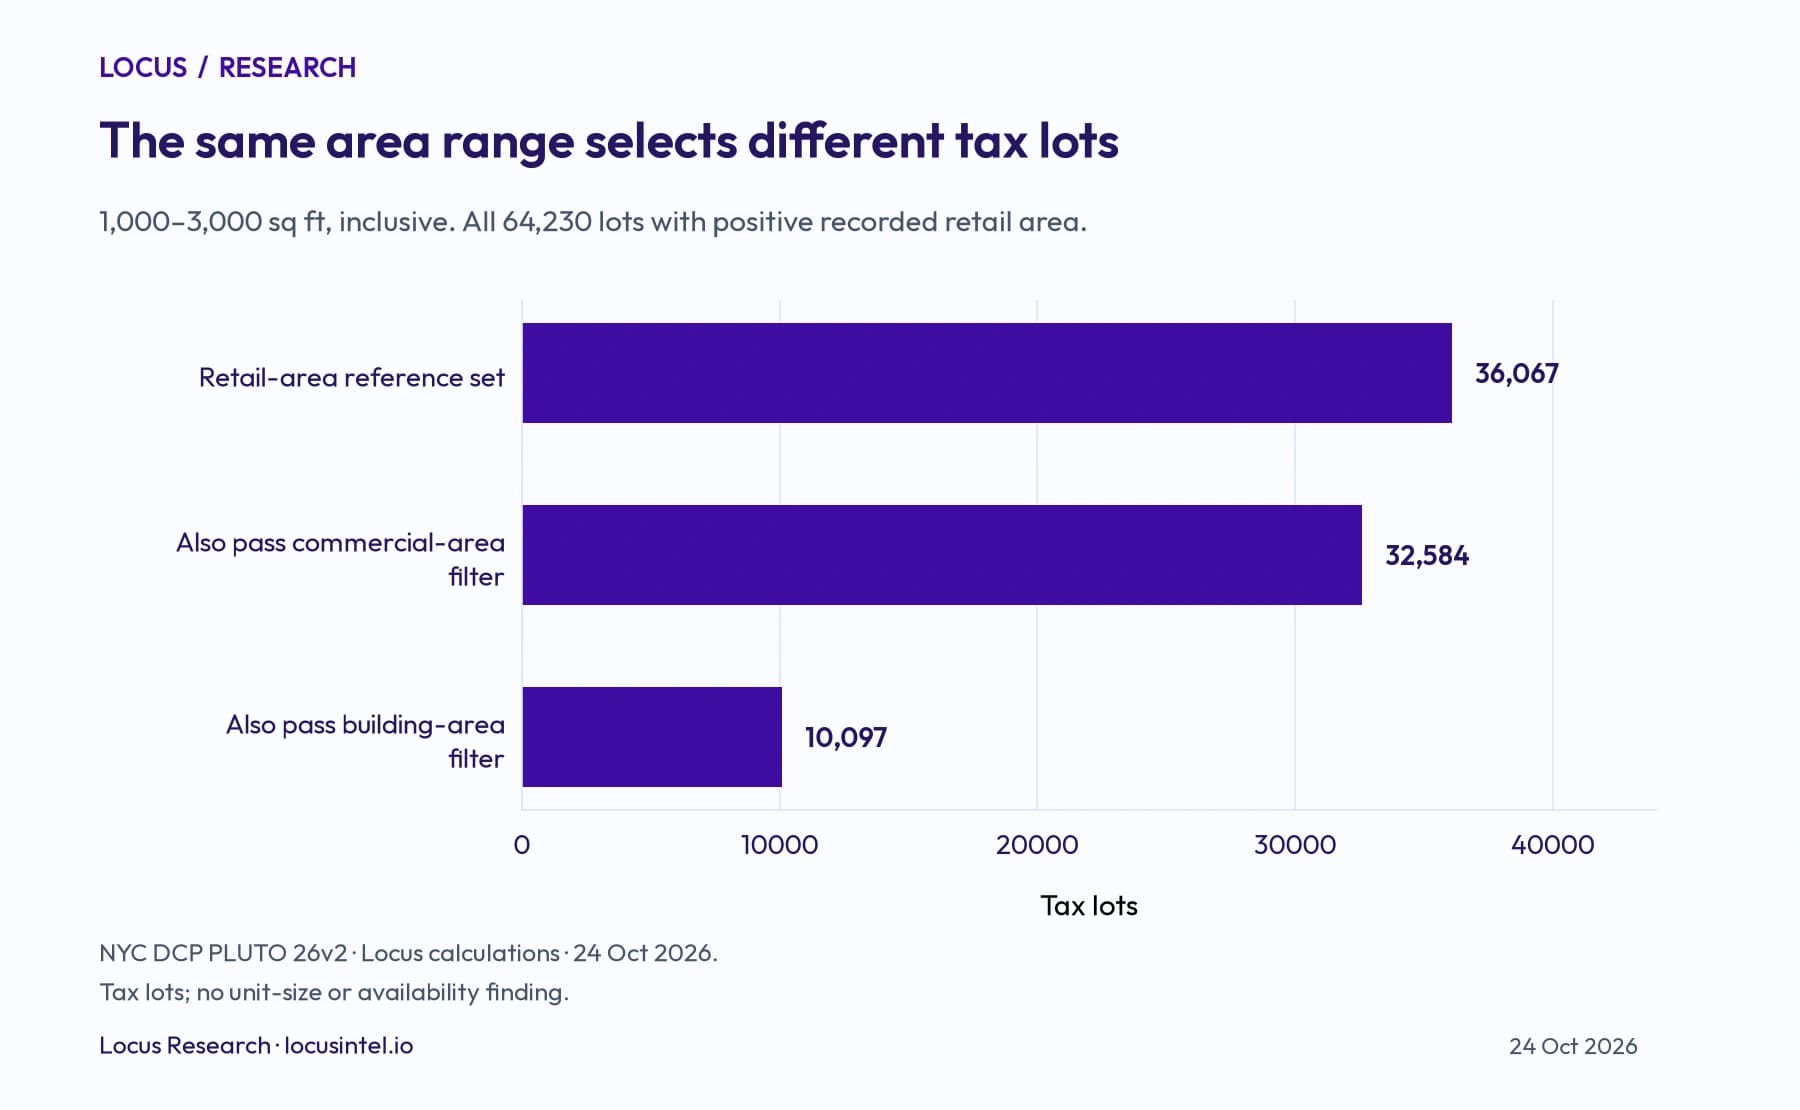
We tested that choice using 64,230 New York City tax lots with positive recorded retail floor area in the Department of City Planning's PLUTO 26v2 release. Of the 36,067 lots with recorded retail area between 1,000 and 3,000 square feet, only 10,097 also met that range on total building area: 28.0%. Using commercial area retained 32,584, or 90.3%.
That is a substantial change to a research list before anyone has assessed a particular premises. It does not establish that the omitted lots contain available shops of the required size. The experiment measures a narrower, reproducible issue: different area fields select different tax lots, and none substitutes for the dimensions of a unit offered for lease.
The question before the market question
Current market research already answers important NYC retail questions. The Comptroller's June 2026 storefront report examines observed vacancy and local clustering; REBNY's first-half 2026 report covers asking rents and activity along Manhattan corridors. Those findings provide market context. Our experiment addresses an earlier step: constructing the property list to investigate.
The PLUTO dataset and field documentation describe tax lots. Total building area covers a different extent from commercial area; commercial area includes uses beyond retail; retail area remains an aggregate for the lot. A mixed-use lot can therefore fall inside a retail-area range while its total building area is much larger.
The useful decision is whether a proposed area filter represents the entity the analyst intends to investigate. An expansion team needs the eventual premises dimensions, layout and availability, even when parcel-level data helps it understand the surrounding property.
What we tested
We downloaded every PLUTO row with RetailArea > 0 on 24 October 2026. All 64,230 records carried version 26v2, and the dataset's recorded update timestamp remained unchanged during collection. Each BBL, the borough–block–lot identifier, appeared once. The extract covered all five boroughs.
The protocol fixed three inclusive intervals before calculating results: 500–1,500, 1,000–3,000 and 2,000–5,000 square feet. They are illustrative analyst assumptions, not established requirements for any particular retail format. We applied each interval separately to building, commercial and retail area, holding the source population constant.
For each comparison, the retail-area-selected lots form a reference set. “Retained” means a lot also passes the same interval on the other field. Retention is intersection divided by the retail reference-set count. It measures agreement between filters; it does not measure accuracy against an independently verified inventory of shops.
One range, three research lists
For the main 1,000–3,000 square-foot interval, the retail-area reference set contained 36,067 lots. The building-area filter selected 15,491 lots from the same source population, but only 10,097 were shared with the reference set. The commercial-area filter selected 33,792, with 32,584 shared.
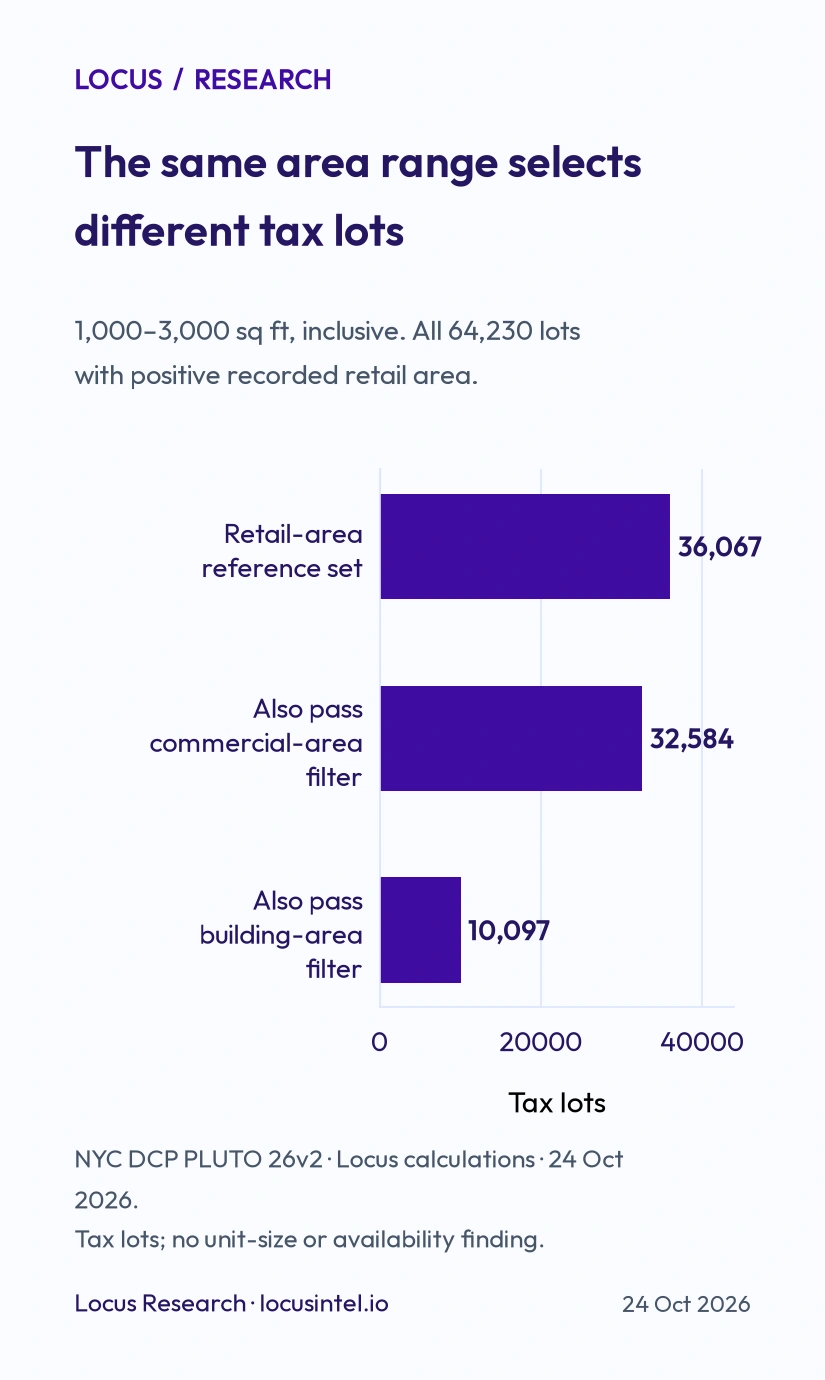
Source: NYC DCP PLUTO 26v2, downloaded 24 October 2026; Locus calculations. The latter two bars show overlap with the same reference set. They do not show all lots selected by those fields or available shop units.
| Filter comparison | Selected by that field | Shared with retail-area set | Retail-set lots retained | Retail-set lots omitted | Other-field-only lots |
|---|---|---|---|---|---|
| Building area versus retail area | 15,491 | 10,097 | 28.0% | 25,970 | 5,394 |
| Commercial area versus retail area | 33,792 | 32,584 | 90.3% | 3,483 | 1,208 |
The building-area filter does more than return a smaller list. It also selects 5,394 lots outside the retail reference set. Both effects matter when an analyst compares lists or hands a shortlist to a broker: changing the column changes membership in both directions.
Commercial area is closer to retail area in this scenario, but the remaining disagreement is still visible. Choosing the closer field does not convert a lot-level measure into a tenant-level one. The appropriate field depends on the research question; the final unit requirement needs premises-level evidence.
The borough difference matters
The same rule has different consequences across NYC. In Manhattan, only 386 of the 7,876 retail-reference lots also passed the building-area interval, a retention of 4.9%. Staten Island retained 854 of 1,343, or 63.6%.
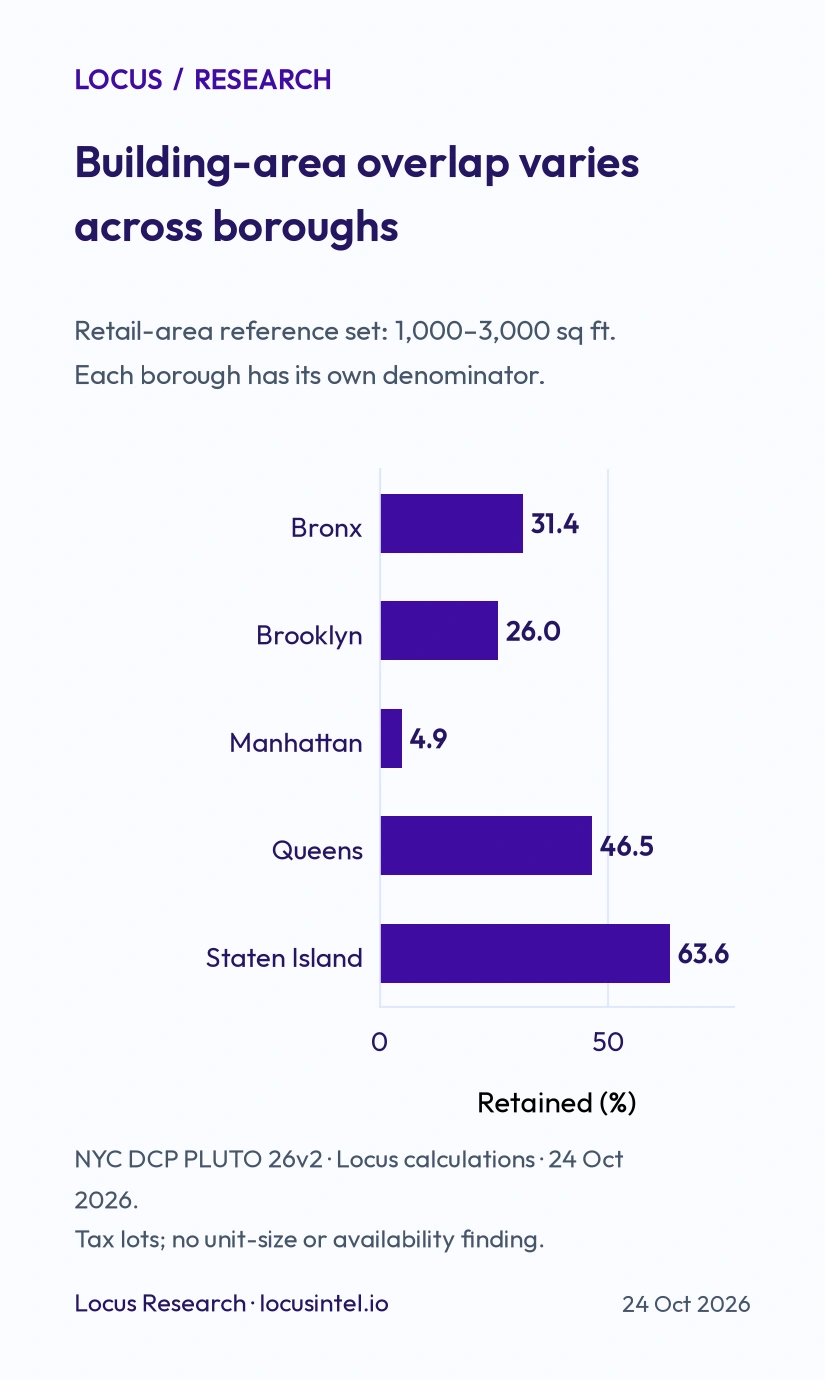
Source: NYC DCP PLUTO 26v2; Locus calculations. Each percentage uses its borough's 1,000–3,000 sq ft retail-area set as denominator. This compares field behavior, not market attractiveness.
| Borough | Retail-area reference lots | Also pass building-area filter | Retained |
|---|---|---|---|
| Bronx | 2,495 | 783 | 31.4% |
| Brooklyn | 15,845 | 4,116 | 26.0% |
| Manhattan | 7,876 | 386 | 4.9% |
| Queens | 8,508 | 3,958 | 46.5% |
| Staten Island | 1,343 | 854 | 63.6% |
These results show why agreement observed in one borough should not be assumed elsewhere. The experiment does not isolate the causes of that variation or establish which borough offers better retail opportunities.
Does the conclusion depend on the assumptions?
The gap persists across the other intervals fixed in the protocol, although its magnitude changes.
| Inclusive area interval | Retail-reference lots | Building-area retention | Commercial-area retention |
|---|---|---|---|
| 500–1,500 sq ft | 27,907 | 7.0% | 87.8% |
| 1,000–3,000 sq ft | 36,067 | 28.0% | 90.3% |
| 2,000–5,000 sq ft | 16,373 | 39.0% | 82.7% |
Restricting the main scenario to the 57,431 lots with exactly one recorded building gives a 32,650-lot retail reference set. Building-area retention becomes 28.4% and commercial-area retention 90.4%. Multiple-building lots therefore do not explain away the main disagreement.
Other planned checks made no change to the population: every extracted row used building-area source code 2 or 7, all three area fields were positive, and every row satisfied retail area ≤ commercial area ≤ building area. Those checks rule out the specified missing-value and nesting issues in this extract. They do not verify measurements on the ground or prove the source contains every retail premises.
A practical handoff for an expansion team
Before applying an area requirement, write down whether it refers to a tax lot, a building, all commercial space, all retail space, or one premises. Carry that entity label with the number throughout the shortlist.
For an existing parcel-based workflow, run the same interval against the relevant fields and inspect the disagreements before discarding records. This study supplies a repeatable comparison, not a reason to choose the largest list. Preserve a separate reason for excluding each candidate so a broad parcel measure does not silently become a claim about a shop.
Then obtain the exact premises address and unit identifier, current marketed area, usable layout, availability, frontage and commercial terms. Only after that can the team combine unit evidence with catchment demographics, access and competition to evaluate a location. A site-analysis brief should keep the premises requirement visible alongside the local-market evidence.
Scope, sources and reproduction
This is a Locus research analysis of public City Planning records, not a Locus app suitability score or a survey of leasable shops. Scripts performed the set calculations; AI assisted the research and writing. The positive-retail-area extract excludes lots whose retail area is zero, missing or not applicable. PLUTO's field documentation specifically says retail-area information is unavailable for one-, two- and three-family structures. Consequently, these percentages do not describe all storefronts, and zero recorded area must not be read as proof that retail use is absent.
PLUTO figures are administrative estimates with their own update lags. Condominium billing lots aggregate records. No vacancy, unit availability, achieved rent, planning consent, customer demand or business performance was measured. Because the analysis enumerates the defined source subset, we report exact counts and assumption checks rather than invented sampling confidence intervals.
To reproduce the experiment, query PLUTO 64uk-42ks, preserve the release and retrieval date, form inclusive sets for each interval, and count intersections. The field metadata explains the measures. Source attribution: NYC Department of City Planning, PLUTO 26v2; calculations and figures by Locus. The NYC Open Data FAQ describes public-data use; City data carries no warranty of completeness or fitness for a particular decision.
Keep reading
Related guides from the Locus library.
AI-Powered Location Intelligence for Local Business Growth
How Locus brings competitor mapping, demographics, foot traffic, catchment analysis, local reputation tracking, and AI recommendations into one practical workflow.
How AI is Revolutionizing Location Intelligence for Businesses
Discover how artificial intelligence is transforming business location decisions. Learn about AI-powered site selection, predictive analytics, and automated insights.