
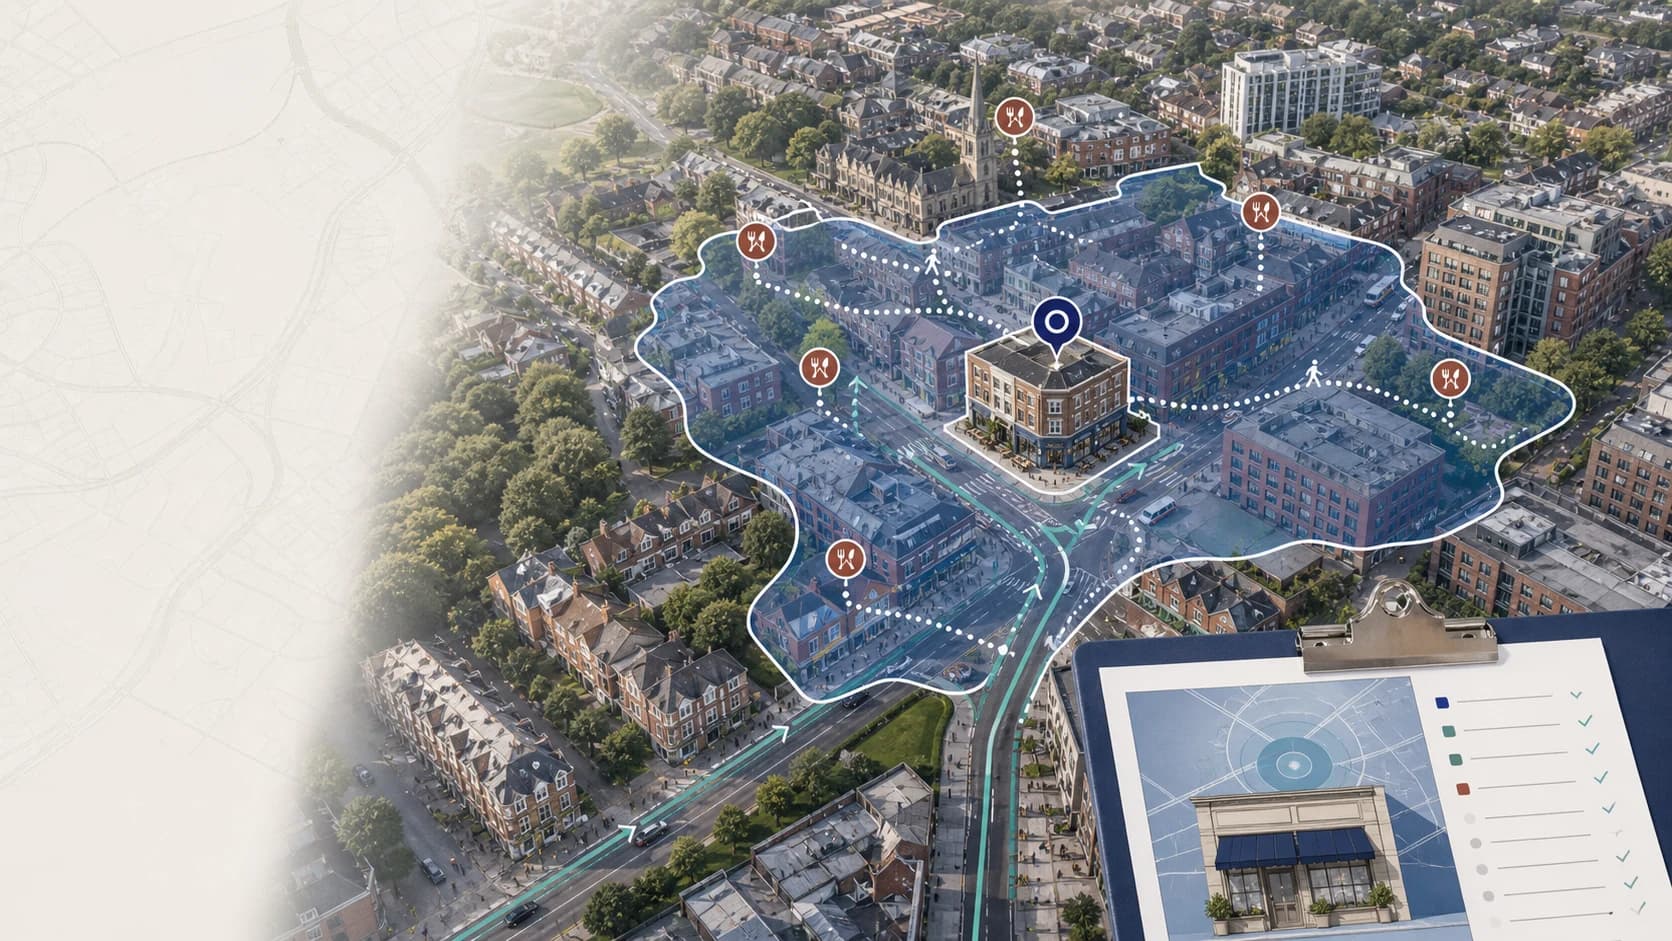
Restaurant Site Selection Analysis: UK vs US
Compare UK and US restaurant sites with a practical framework for demand, catchments, competitors, access, dayparts, and lease economics.
Ahmed
Founder of Locus
Restaurant site selection analysis is the process of testing whether a candidate address can support a specific restaurant concept before the team commits to a lease, franchise approval, or detailed property diligence. It combines customer fit, reachable demand, daypart activity, competition, access, operating constraints, and lease economics.
The geography changes the evidence, but not the decision logic. A UK town-centre restaurant may depend on walking routes, rail and bus access, small-area demographics, and high-street visibility. A US suburban or strip-centre restaurant may depend more on drive-time reach, parking, road access, household income, and a wider trade area. In both cases, the right question is not “Does this address look busy?” It is “Can this concept reach enough of the right customers at the times it trades, with costs and constraints that leave room for a viable operation?”
What should restaurant site selection analysis measure?
A useful analysis connects six evidence layers:
- Concept and customer fit: price point, format, cuisine, occasion, opening hours, service model, and the customer profile the concept needs.
- Reachable demand: population, households, workers, visitors, and the realistic distance or travel time customers will accept.
- Daypart activity: whether the site is active during breakfast, lunch, afternoon, dinner, late evening, or the weekend windows that matter to the concept.
- Competitive context: direct restaurants, adjacent categories, ratings, review volume, clustering, whitespace, and overlap with existing locations.
- Access and operations: visibility, entrances, parking, transit, delivery access, extraction, loading, seating, licensing, and planning constraints.
- Property economics: rent, rates, service charges, fit-out, labour implications, projected covers, average ticket, and the cost of being wrong.
No layer is decisive alone. A large residential population may not help a lunch-led concept if the site has little daytime activity. A busy high street may create awareness but still fail if the unit cannot support extraction or delivery. A competitor cluster may be a demand signal, a saturation risk, or both.
How does the evidence change between the UK and US?
UK town-centre and high-street sites
Start with small-area customer context. The Office for National Statistics Census is a useful source for population, age, households, employment, and housing variables. Locus uses UK MSOA-level demographic data where available, but an MSOA is a screening unit, not a guarantee that every street inside it behaves the same way.
Test a radius alongside a walking or driving catchment. A river, ring road, rail line, pedestrianised street, one-way system, or poor crossing can make a circular catchment overstate reach. For a café or quick-service restaurant, a five-minute walking view and a lunch-daypart site visit may be more useful than a broad city average.
Property diligence also needs to be early. Frontage, sightlines, pavement width, neighbouring uses, licensing, extraction, refuse storage, delivery windows, and evening activity can change the value of an otherwise attractive unit.
US suburban, strip-centre, and drive-through sites
For US markets, the Census Bureau's American Community Survey provides tract-level demographic and economic estimates. Use the tract as context, then test how roads, junctions, parking, barriers, and competing centres shape actual reach. A large population inside a drive-time polygon is not the same as a large pool of likely restaurant visits.
Drive-time assumptions deserve particular scrutiny. A site beside a high-speed road may have strong vehicle counts but weak access. A centre with easy parking and several complementary destinations may outperform a more visible unit that is difficult to enter or exit. For a drive-through or pickup-led format, queueing, stacking, delivery circulation, and ingress/egress should be explicit decision fields rather than footnotes.
The same principle applies across both markets: use the geography to choose the right evidence, not to make a weak signal look precise.
What is the practical workflow for comparing restaurant sites?
1. Define the concept and the decision gate
Write down the format, target customer, price point, opening hours, service radius, required access, minimum unit size, and non-negotiable property constraints. A neighbourhood dinner restaurant, a commuter breakfast café, and a drive-through quick-service format should not share the same weights.
2. Screen the market before comparing addresses
Use demographic and catchment evidence to decide whether a town, district, suburb, or corridor deserves further work. This is the market-screening stage. Reject a market that fails a hard customer-fit or access condition before spending time on detailed lease comparisons.
3. Build comparable catchments around the shortlist
Use the same radius, travel-time settings, time windows, and business category for each candidate. The Mapbox Isochrone API explains the network-based method behind travel-time polygons. A radius communicates scale; a travel-time catchment tests realistic reach. Keep both when stakeholders need to understand the difference.
4. Map direct competitors and demand context
The Google Places API can help discover nearby businesses, categories, ratings, review counts, and locations. Treat the result as a discovery layer rather than a perfect census: category labels vary, businesses change, and one result set should not be presented as total market share.
Read competitor density alongside customer fit and daypart activity. Five similar restaurants in a strong dining cluster may validate demand. Five similar restaurants in a small, poorly matched catchment may signal saturation. For a multi-location operator, also check catchment overlap and possible cannibalisation.
5. Stress-test the property economics
Use the same financial assumptions for every candidate, then replace assumptions with broker, landlord, and operator evidence as the shortlist narrows. An illustrative calculation shows why this matters: if annual occupancy cost is £72,000 and the operator's planning rule caps occupancy at 8% of sales, the site needs £900,000 in annual sales before other operating costs. At an £18 average ticket over 360 trading days, that is about 139 covers per day. This is a break-even framing exercise, not a Locus forecast or a claim about any market.
A 100-point restaurant site scorecard
Use a scorecard to structure discussion, not to hide uncertainty:
| Dimension | Weight | Evidence to test |
|---|---|---|
| Concept and customer fit | 20 | Demographics, households, price fit, customer occasion, and format match |
| Reachable demand | 20 | Radius, travel time, walk/drive access, daytime population, and catchment barriers |
| Daypart activity | 15 | Activity patterns matched to opening hours, observed visits, and available foot-traffic signals |
| Competitive context | 15 | Direct competitors, adjacent destinations, ratings, review volume, clustering, and overlap |
| Access and operating fit | 15 | Visibility, parking/transit, entrances, delivery, extraction, loading, licensing, and planning |
| Property economics | 10 | Rent, rates, service charges, fit-out, labour assumptions, covers, and average ticket |
| Evidence quality | 5 | Source recency, coverage, confidence, and unresolved assumptions |
| Total | 100 | Illustrative framework; reweight for the concept and hold weights constant across sites |
Evidence quality belongs in the model because a neat score built from stale or incomplete data is not a strong recommendation. Keep a separate list of what still needs a site visit, landlord confirmation, planning check, licensing advice, or operator validation.
How can Locus support the first restaurant site screen?
Locus is useful for the repeatable evidence layer before specialist diligence. Search an address, select the restaurant or relevant business type, set comparable catchment assumptions, inspect competitors, and review demographic context. Where coverage is available for the venue and plan, hourly activity signals can help test daypart fit. Locus can also provide an AI location assessment, compare candidate locations, and export a report-ready view; the output is a decision aid, not a guaranteed revenue forecast.
The existing restaurant site-selection framework covers the core factors in a general restaurant context. Use trade area analysis to refine customer reach, and use demographic analysis for business site selection to test customer fit. Keep the job split clear: the map narrows the question, while fieldwork and commercial diligence decide whether the property can work.
What should happen before a restaurant lease is signed?
Advance only the sites that pass the hard gates and have a credible evidence trail. Then:
- Visit during the concept's key dayparts, including a realistic quiet period.
- Confirm frontage, access, parking, transit, extraction, power, refuse, loading, and delivery constraints.
- Verify planning, licensing, rates, service charges, landlord works, and fit-out obligations.
- Re-run the economics when rent, incentives, unit size, or opening assumptions change.
- Record data dates, source coverage, missing fields, and the reasons a site advances or stops.
Restaurant site selection analysis is strongest when it narrows uncertainty before the lease becomes expensive. Use the same framework across UK and US candidates, adapt the evidence to the local geography, and keep proxy scores separate from forecasts.
Analyse any location in Locus → Start with the Locus location workflow
Keep reading
Related guides from the Locus library.
AI-Powered Location Intelligence for Local Business Growth
How Locus brings competitor mapping, demographics, foot traffic, catchment analysis, local reputation tracking, and AI recommendations into one practical workflow.
How AI is Revolutionizing Location Intelligence for Businesses
Discover how artificial intelligence is transforming business location decisions. Learn about AI-powered site selection, predictive analytics, and automated insights.