

What UK Business Counts and Property-Sale Records Can—and Cannot—Tell You About a Location
A bounded Leeds and Manchester comparison separates registered business activity from recorded property-sale evidence and shows which site-selection questions remain unanswered.
Sara
Head of Growth
Before a site-selection team compares two places, it needs to know what each data source is actually measuring.
That sounds obvious. In practice, a registered-business count, a local-unit count and a property-sale record can appear together in the same location brief and quietly acquire meanings they do not support. A business count is not customer demand. A property transaction is not current availability. A recorded price is not rent, profitability or a recommendation.
This bounded comparison uses two official sources for Leeds and Manchester to make those boundaries visible. It is a source-definition study, not a league table or a verdict on where to open a site.
The buyer question
The useful first question is not “Which city wins?” It is:
Which layers of evidence describe the local business environment, which describe recorded property transactions, and what must be collected separately before a site can be assessed?
Answering that question prevents a quick screen from becoming a false measure of opportunity. It also gives an expansion team a clearer next request: current listings, lease terms, footfall, customer demand, category performance and site-level constraints must be sourced on their own terms.
What we fixed before looking at the result
The comparison uses two local authority districts: Leeds and Manchester.
For business activity, we used the Office for National Statistics UK Business: Activity, Size and Location 2026 workbook. The workbook is based on an IDBR snapshot taken on 13 March 2026. We extracted the published, control-rounded totals for registered enterprises and registered local units for each district.
The ONS quality and methodology information defines enterprises and local units as different statistical units. The source describes counts of VAT- and/or PAYE-registered businesses at a March reference point; it does not provide a live count of open premises, vacancies or customer visits.
For property evidence, we used the HM Land Registry 2025 yearly Price Paid Data file, retaining rows whose District field equals Leeds or Manchester. Those are property-address district labels, not the same statistical unit as the ONS local-authority totals. The file contains recorded sale observations with fields such as price, transfer date, property type and town or city. The HM Land Registry guidance explains the scope and exclusions of the dataset and cautions that registration timing affects what appears in the file.
The protocol therefore excludes claims about commercial rent, current availability, vacancy, footfall, customer demand, catchment demand, revenue, profitability, lease terms, business survival and site recommendation.
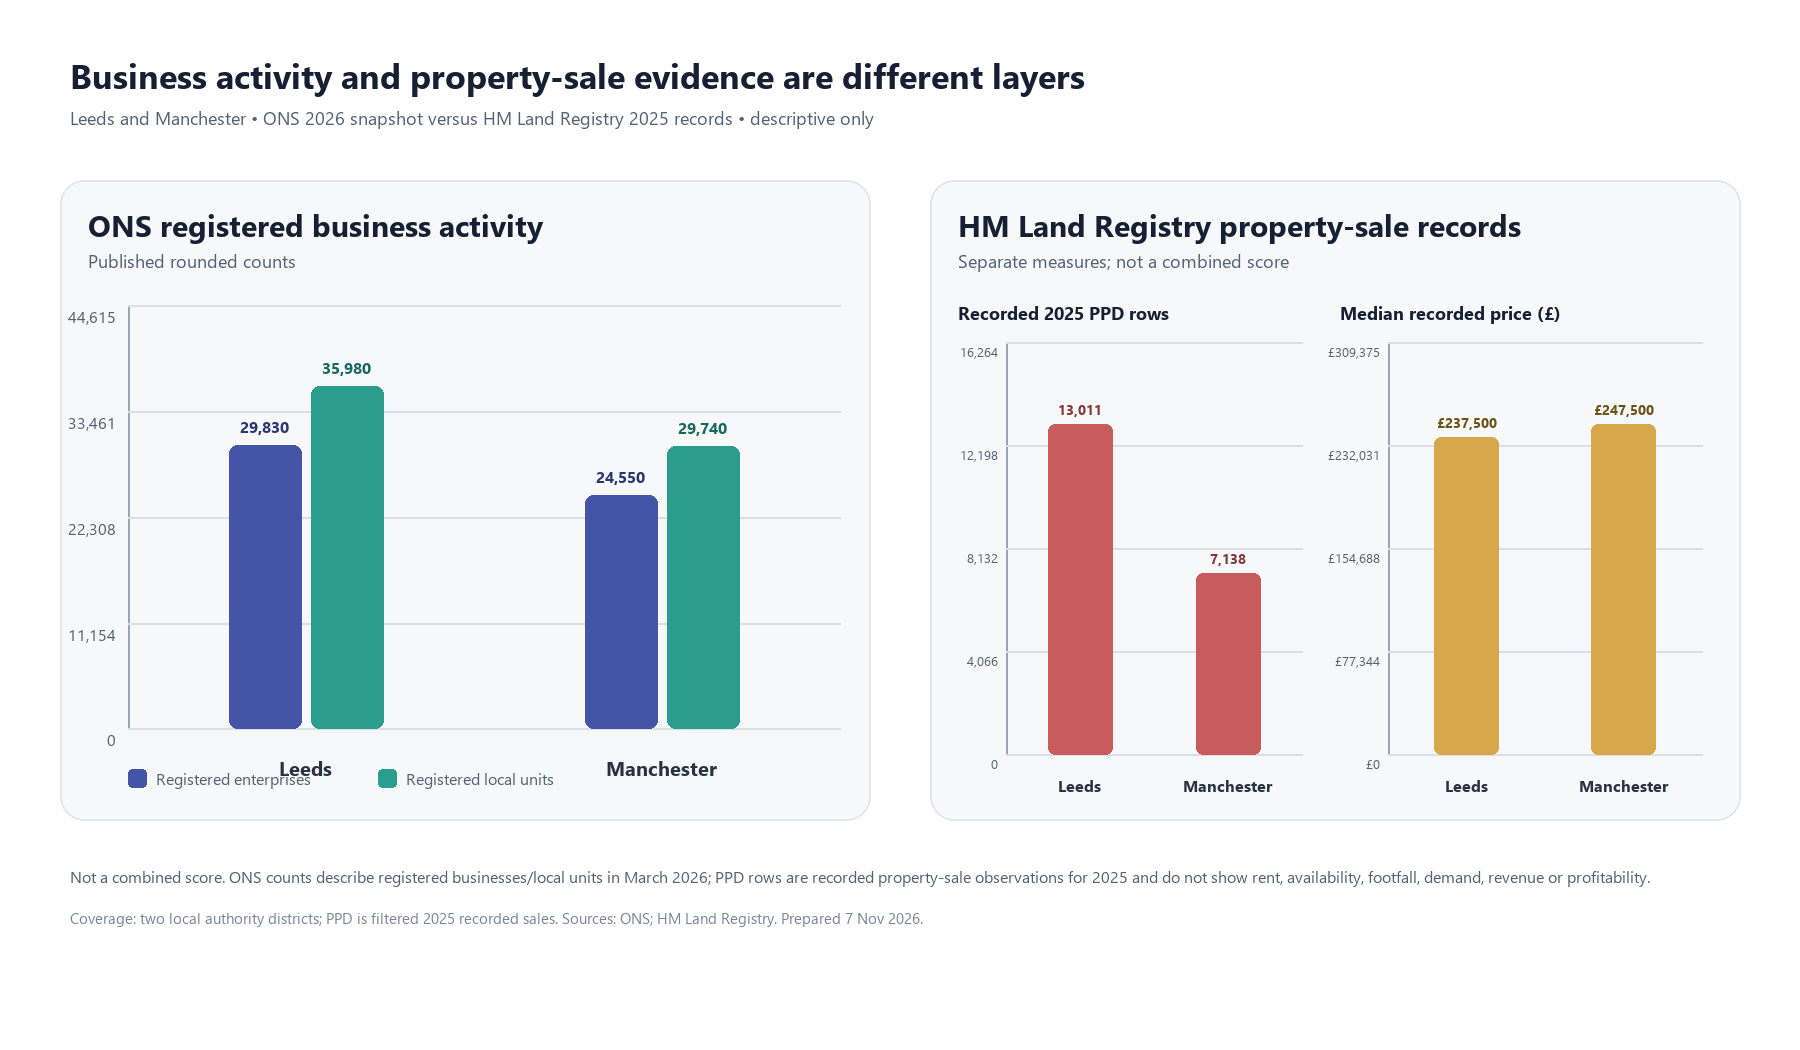
The two datasets describe different layers
The ONS 2026 snapshot contains:
| Local authority district | Registered enterprises | Registered local units |
|---|---|---|
| Leeds | 29,830 | 35,980 |
| Manchester | 24,550 | 29,740 |
These figures are useful as a description of registered business activity at the district level. The local-unit total is higher than the enterprise total in both places because a single enterprise can operate through more than one local unit. Neither number says how many premises are currently trading, how many are suitable for a particular category, or how many customers a location could attract.
The HM Land Registry extract contains a different kind of evidence:
| District filter | 2025 recorded sale rows | Median recorded price |
|---|---|---|
| Leeds | 13,011 | £237,500 |
| Manchester | 7,138 | £247,500 |
These are recorded property-sale observations, not a register of available sites. The district field also spans more than one town or city label. In the Leeds extract, the most frequent town/city values include Leeds, Pudsey, Wakefield, Wetherby and Otley. In the Manchester extract, most rows are labelled Manchester, with additional rows for Sale, Salford, Altrincham and other places. That means a district-level median is not the same thing as a typical price on a particular high street or in a defined catchment.
The price distribution is also wide. The middle 50% of recorded prices runs from £170,000 to £335,000 in Leeds and from £180,000 to £345,825 in Manchester. The minimum and maximum values are much farther apart. A median is a useful summary of this file, but it is not a budget estimate for a new lease or purchase.
Why a combined score would be misleading
It would be tempting to place the business counts and property prices into one “opportunity” score. That would create a number, but not a defensible decision measure.
The sources differ in at least four ways:
- Unit: an enterprise, a local unit and a property-sale record are not interchangeable observations.
- Time: the ONS measure is a March 2026 snapshot, while the property file covers recorded 2025 transfers.
- Geography: both are filtered to local authority districts, but the property file’s town/city labels show how much internal variation remains inside those boundaries.
- Decision meaning: business counts describe registered activity; sale records describe transactions that were recorded. Neither establishes availability, demand or financial return.
The right result is therefore a layered evidence brief, not a blended ranking. The layers can help an analyst decide what to investigate next, but they cannot substitute for the missing decision evidence.
What this changes in a site-selection workflow
For an early location screen, the comparison suggests a simple sequence:
1. Name the measure before using the number
Write “registered enterprises,” “registered local units” or “recorded property-sale rows,” not “businesses,” “sites” or “opportunities.” Precision in the label prevents an expansive interpretation later.
2. Keep the reference date beside the value
A March 2026 business snapshot and a 2025 transaction file are not a single current-state view. A decision brief should preserve both dates and state what has not been refreshed.
3. Treat the district as a container, not a catchment
Local authority geography is useful for consistent comparison, but it is not automatically the trade area around a proposed address. A next-stage screen needs a defined catchment and a method suited to that catchment.
4. Request the missing evidence directly
Availability, asking rent, lease terms, footfall, customer demand, competitor intensity and category performance require separate sources and checks. A property-sale median should not be used as a proxy for any of them.
5. Use the evidence to choose the next question
The value of this comparison is diagnostic. It tells the team where the official sources stop. That makes the next validation step more specific: inspect a defined set of current listings, verify a category in a stated catchment, or test observed demand with an appropriate current measure.
The contribution in one sentence
For Leeds and Manchester, official business counts and recorded property-sale observations can be reproduced and placed side by side, but their different units, dates and meanings make them a decision map—not a site score.
Sources and licensing
- Office for National Statistics, UK Business: Activity, Size and Location, 2026 and its quality and methodology information.
- HM Land Registry, Price Paid Data yearly file and about the Price Paid Data.
The HM Land Registry data is used under the Open Government Licence v3.0 with the attribution: “Contains HM Land Registry data © Crown copyright and database right 2021.” The illustrative header image is an editorial scene, not a photograph of Leeds, Manchester or a particular property.
Keep reading
Related guides from the Locus library.
AI-Powered Location Intelligence for Local Business Growth
How Locus brings competitor mapping, demographics, foot traffic, catchment analysis, local reputation tracking, and AI recommendations into one practical workflow.
How AI is Revolutionizing Location Intelligence for Businesses
Discover how artificial intelligence is transforming business location decisions. Learn about AI-powered site selection, predictive analytics, and automated insights.