
Non-London Town Centre Coffee Screen: What the Data Can—and Cannot—Say
A reproducible 233-centre coffee opportunity screen shows why accessibility and current POI refreshes matter before a high-street ranking is published.
Adam
Marketing Manager
If you are choosing a town-centre location for a coffee concept, a shortlist is useful only when you can explain what it measures, which places were compared and how stable the result is.
This Locus research release adds a non-London calibration component to the UK High Street Opportunity Index. It scores 233 GeoDS Town Centre records outside London using audited catchment demographics, coffee/cafe POI counts, accessibility and market-resilience proxies. The result is a screen for follow-up—not a claim that Redhill is the UK's best coffee location.
The headline result is a warning worth acting on: Redhill leads the base screen at 85.1, but an accessibility-led scenario moves Bootle into first place and retains only 2 of the base top ten. The model is therefore useful for narrowing the next question, not for replacing a site visit, unit review or operator judgement.
What was compared
The national starting universe is GeoDS Retail Centre Boundaries v4.0: 9,623 unique UK retail centres, including 8,116 in England, 811 in Scotland, 459 in Wales and 237 in Northern Ireland. The component keeps one comparable peer group—Town Centre—and then removes London to answer a narrower question: how does the coffee screen behave across the rest of the UK?
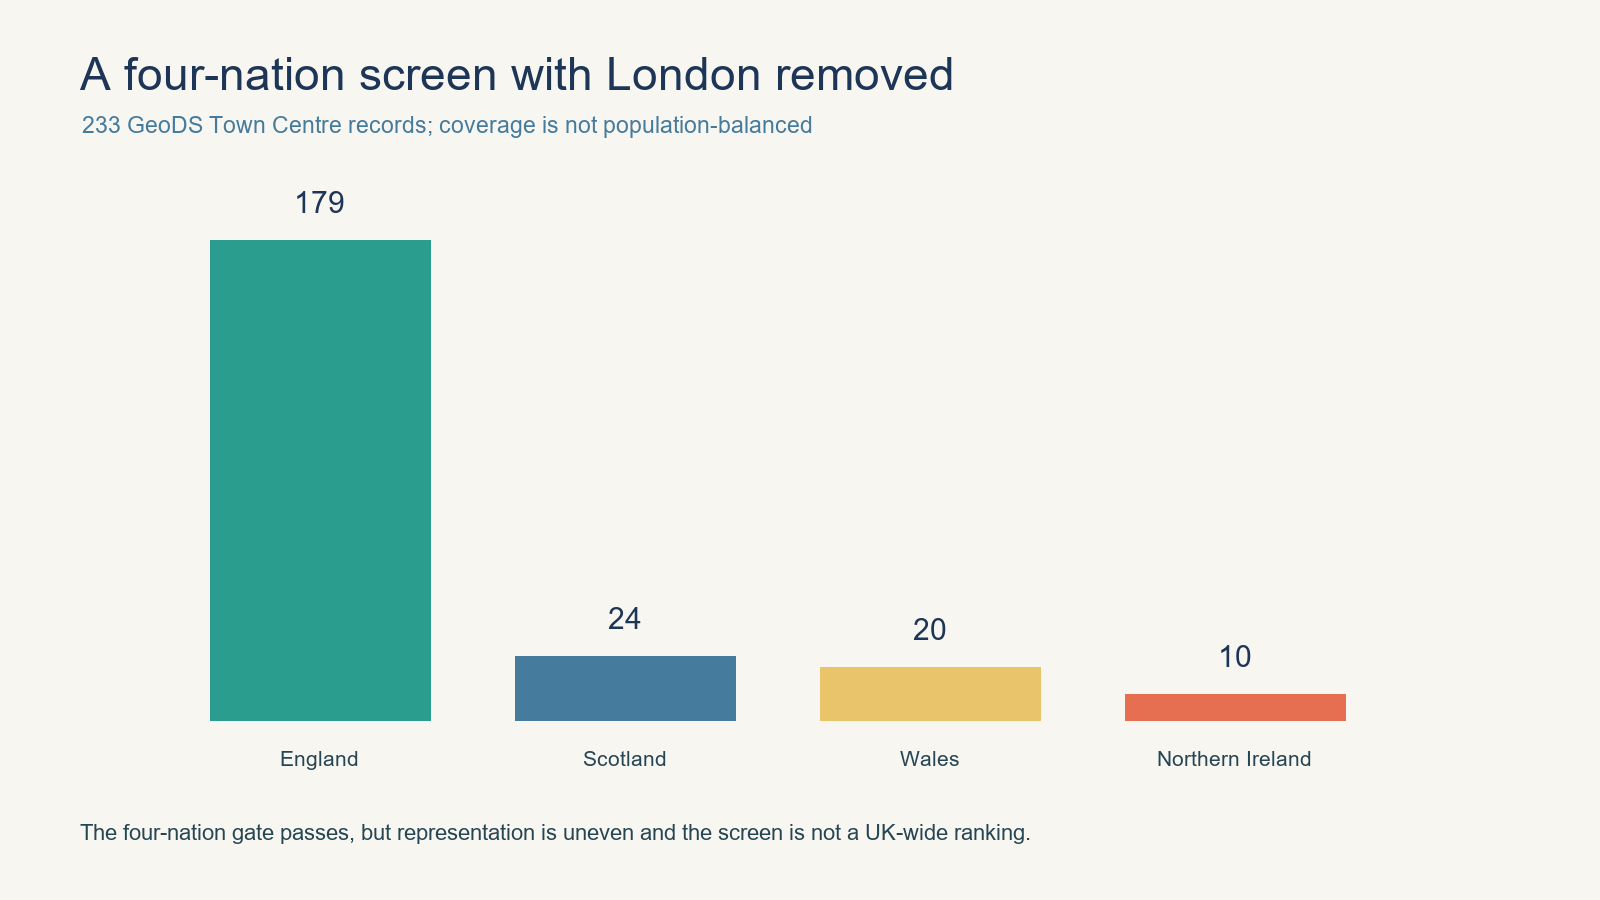
That leaves 233 centres: 179 in England, 24 in Scotland, 20 in Wales and 10 in Northern Ireland. All four nations are present, but the representation is uneven. This is a coverage pass, not a population-balanced sample and not a UK-wide ranking.
The demographic layer is the GeoDS Unified UK Census Data 2021/2, a harmonised dataset covering 239,023 small areas across 25 topic tables and 215 variables. England, Wales and Northern Ireland use 2021 census data; Scotland uses 2022 data. That one-year difference, plus country-specific definition and disclosure-control differences, remains a live caveat.
For category competition, the calculation uses the locally audited Overture Places 2026-07-22.0 extract: 58,055 UK coffee/cafe candidates after the declared category and operating-status rules. The official Overture release calendar now identifies 2026-08-19.0 as the latest release, so this run does not present the POI snapshot as current market evidence. A refresh against the latest release is required before treating the screen as a current competitor count.
Nomis UK Business Counts 2025 was reviewed as an official cross-check. It was not scored because its available local-unit geographies are not equivalent to these retail-centre catchments. No incompatible geography was silently used to fill the gap.
How the score works
Each centre uses the GeoDS retail-centre polygon plus a 1 km metric buffer. Census counts are allocated from intersecting small areas by the share of each small-area geometry that overlaps the catchment. The coffee vertical then combines four components as percentile ranks within the 233-centre peer group:
- Demand potential: 35%.
- Competitive headroom: 30%.
- Accessibility: 20%.
- Market resilience: 15%.
Competitive headroom is expressed as catchment population per relevant coffee/cafe POI. Higher values indicate fewer counted competitors relative to the surrounding population, not guaranteed unmet demand. The score does not include rent, vacancy, frontage, planning status, footfall, brand fit, cannibalisation, customer spend or the operator's execution plan.
The earlier 20-centre manual pilot—five centres per nation—was reused as the source and category validation gate. All 20 prior checks passed. This run is a derived calibration component from the audited feature table; it does not claim a fresh manual inspection of all 233 centres.
Redhill leads the base screen—but only narrowly enough to investigate
Redhill ranks first at 85.1, followed by Basildon at 84.1, Maidenhead at 81.4, Aldershot at 81.2 and Borehamwood at 80.2. The base top ten also includes Walkden, Harlow, West Bridgford, Dartford's New Town and Kingswood.
Redhill's profile explains the composite result: about 20.3k residents are allocated to its catchment, nine coffee/cafe POIs are counted in the 0.8 confidence run, and the population-per-POI headroom measure is about 2,251. Its market-resilience proxy is 90.6. None of those values proves that a particular unit will trade well; they identify why the centre deserves a closer look.
Basildon is a useful contrast. Its catchment population is larger at about 28.7k, but it has 15 counted coffee/cafe POIs and a lower resilience proxy of 65.1. It remains second because the weighted percentile combination rewards a different balance of demand, headroom, accessibility and resilience.
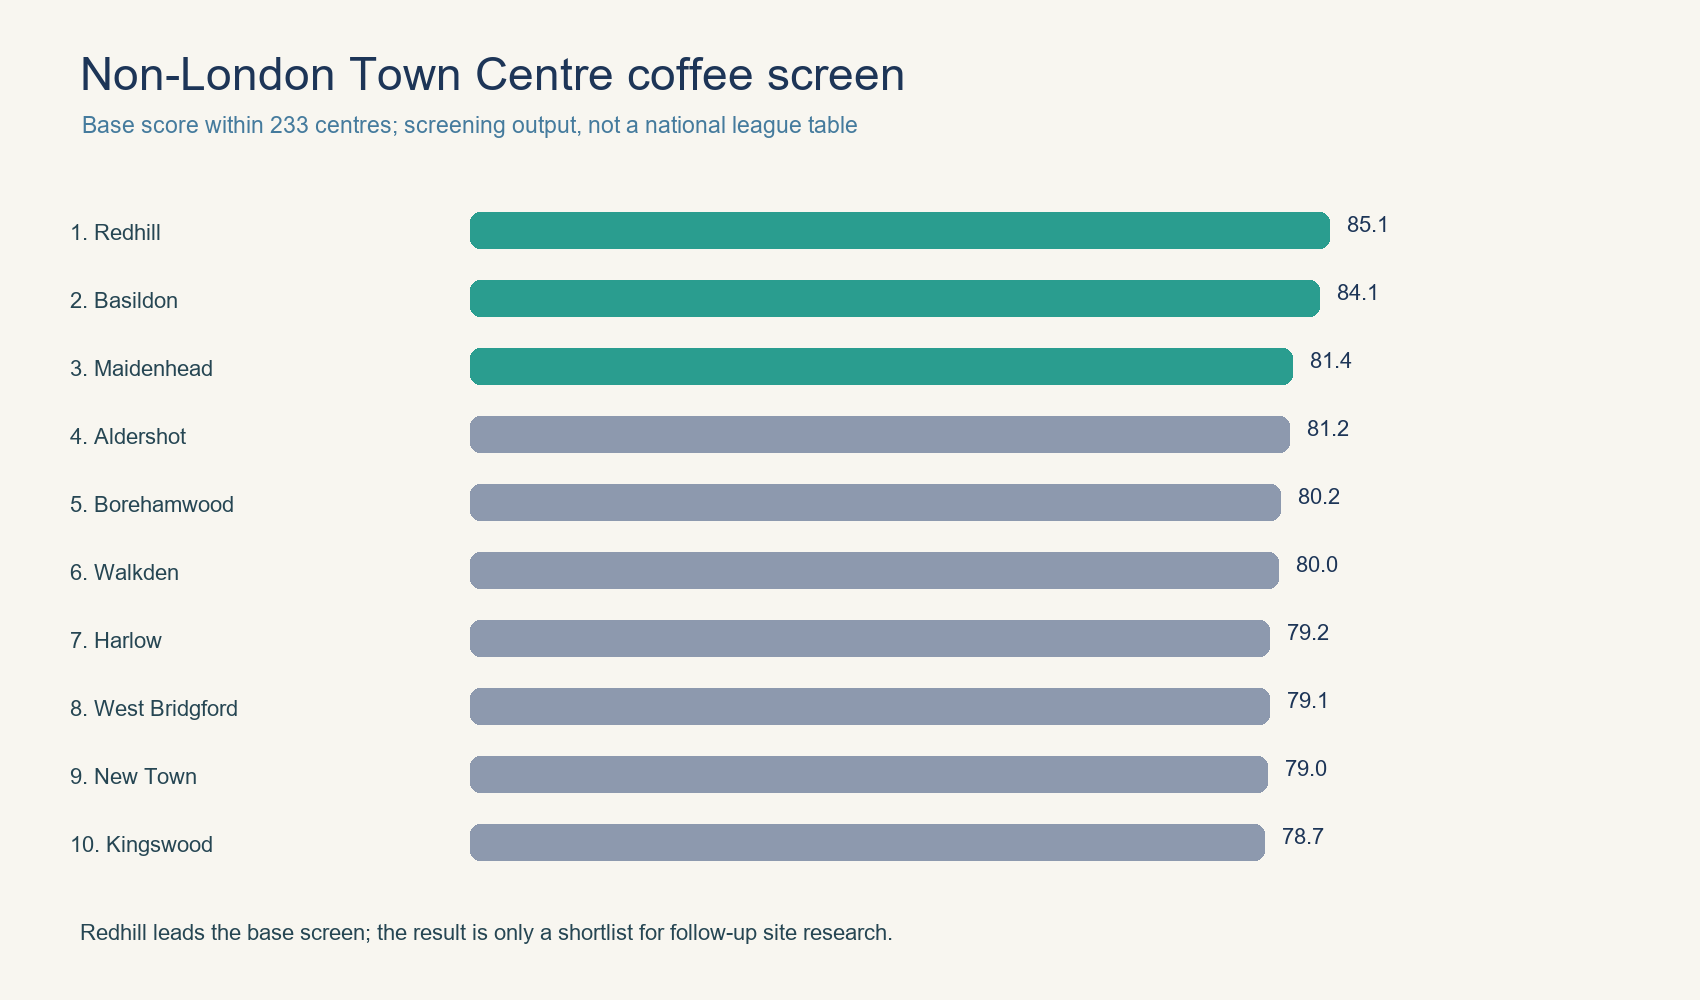
The top ten are all in England. That is not a finding that the other three nations have no opportunity. It is evidence that the current peer group, catchment construction, source coverage and proxies do not yet support a representative UK league table.
Accessibility is not a cosmetic adjustment
The strongest stress test increases the accessibility weight from 20% to 45%, while reducing demand, headroom and resilience to 20%, 20% and 15%. Bootle becomes the scenario winner and only 2 of the base top ten remain in the top ten. The largest rank shift among the base top ten is 60 places.
The resilience-led scenario keeps Redhill first but retains only 7 of 10 base rows. Replacing the base POI confidence treatment with the 0.7 threshold changes the winner to Basildon and retains 8 of 10 rows. The 0.9 threshold retains 9 of 10 and keeps Redhill first.
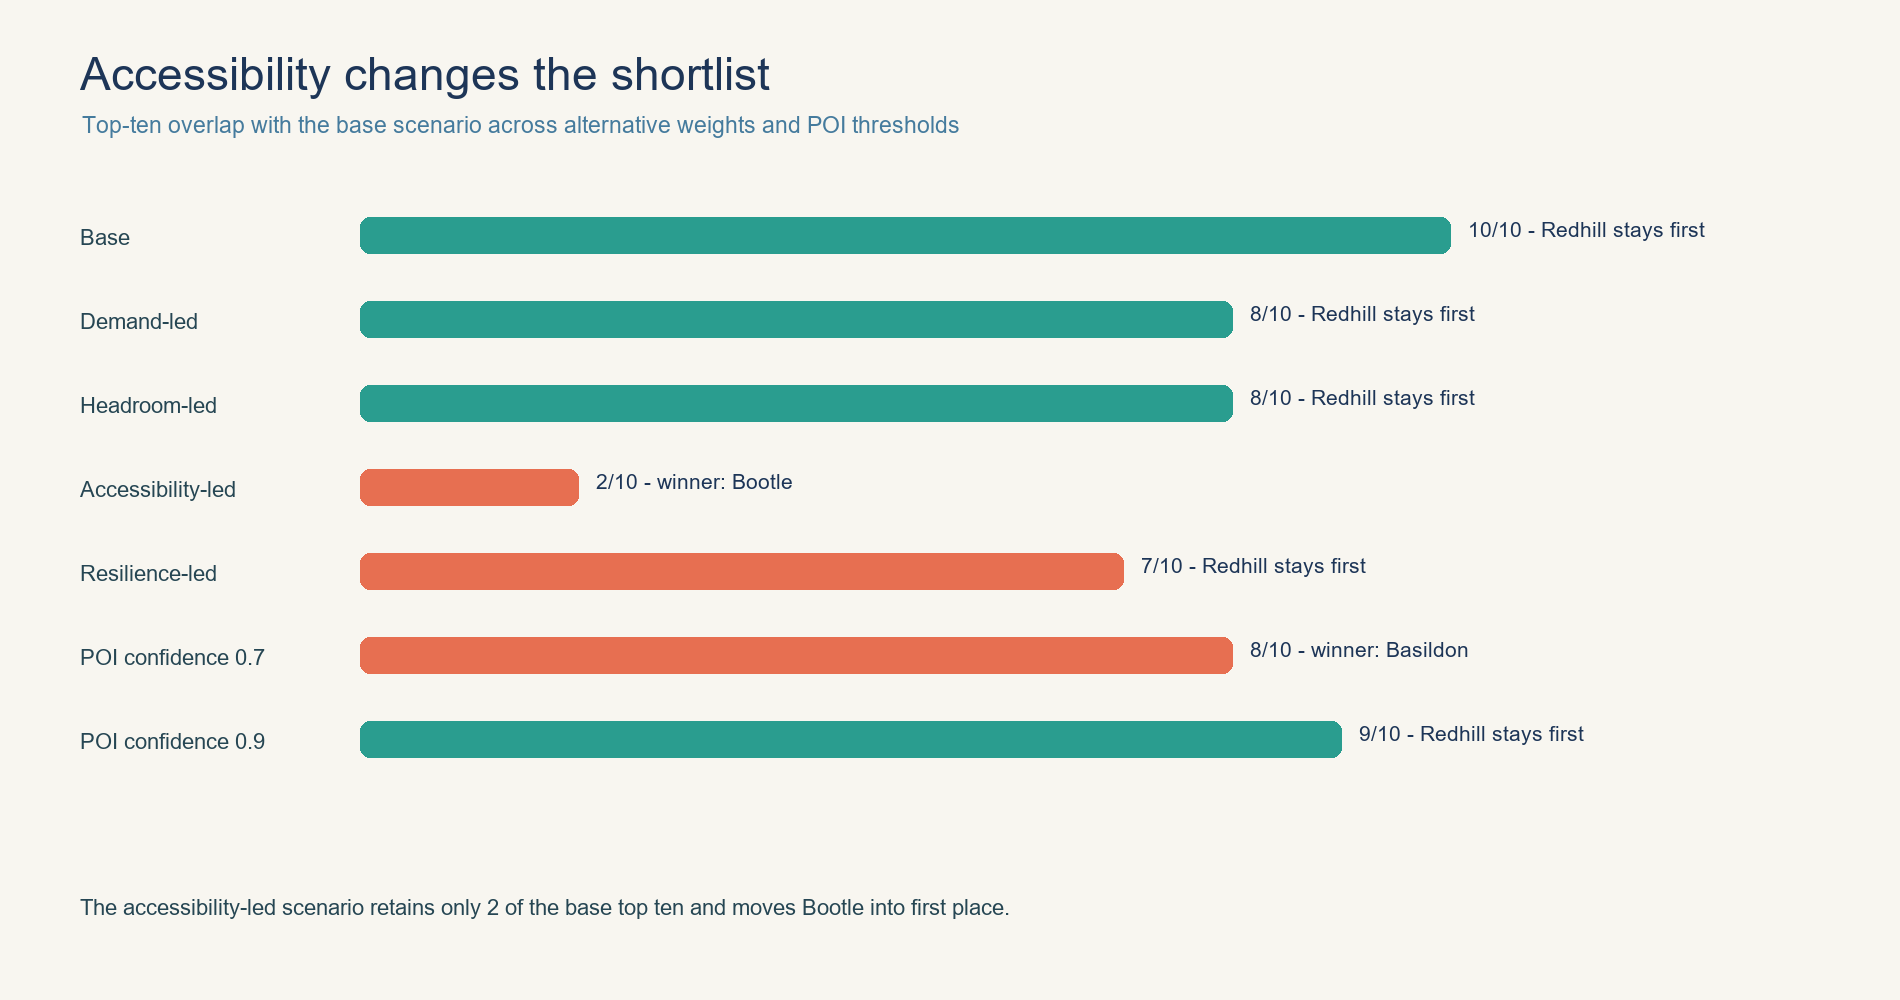
This is why the article publishes a calibration screen instead of a winner. If a decision depends on access, the analyst should not hide that preference inside a single score. Run the access-led view, inspect the places it promotes and test the actual pedestrian, transit and road context around the unit.
What operators and property teams should do next
For a coffee operator or franchise expansion team, use the screen to select a small set of centres for fieldwork. Start with Redhill, Basildon, Maidenhead, Aldershot and Borehamwood if the base balance is relevant; include Bootle if access is a strategic priority. Then check the actual unit, frontage, visibility, service access, rent, planning, nearby anchors, opening hours and the competitive offer.
For a CRE or property adviser, show the comparison universe and the sensitivity result together. The most defensible client conversation is not “the model picked Redhill.” It is “Redhill is a reasonable base-case shortlist candidate, but the conclusion changes when access becomes more important, so here is the evidence we need to verify on the ground.”
For a BID or council, the result can support a diagnostic conversation about what a town centre is trying to improve. A screen that changes under accessibility assumptions is a prompt to examine arrival routes, bus interchange, walking conditions and the relationship between retail, leisure and evening uses—not proof that a new coffee operator should be subsidised or approved.
A useful high-street index should narrow the next investigation without hiding the assumptions that decide who appears at the top.
All calculations were run in the Locus research workflow. Locus combines demographics, catchment context, competitor mapping, accessibility and location interpretation so teams can validate a candidate site before a viewing, lease discussion or approval. Run a free site analysis at Locus.
Sources and licensing
- GeoDS Retail Centre Boundaries v4.0, UK Open Government Licence. Required attribution: “The data for this research have been provided by the Geographic Data Service (geods.ac.uk), a Smart Data Research UK Investment: ES/Z504464/1. This product contains data derived from Foursquare Open Source Places (Foursquare, licensed under the Apache License 2.0) and OpenStreetMap (OpenStreetMap contributors, licensed under ODbL 1.0).” See also An Open Framework for Delineating and Classifying Retail Centres across the United Kingdom.
- GeoDS Unified UK Census Data 2021/2, UK Open Government Licence; harmonised data from ONS, NRS and NISRA with 2021/2022 census-year caveats.
- Overture Places guide, release calendar and attribution guidance; the scored local extract is release
2026-07-22.0and the latest official release checked for this run is2026-08-19.0. - Nomis UK Business Counts 2025, reviewed as a cross-check but not joined to the score.
Reproducibility note
The source manifest, hashes, schema audit, coverage audit, scored CSV, sensitivity JSON and calculation script are retained with this article package. No 2022 GeoDS indicators were joined to v4.0 centre IDs without a validated crosswalk. The national ranking gate remains held.
Keep reading
Related guides from the Locus library.
AI-Powered Location Intelligence for Local Business Growth
How Locus brings competitor mapping, demographics, foot traffic, catchment analysis, local reputation tracking, and AI recommendations into one practical workflow.
How AI is Revolutionizing Location Intelligence for Businesses
Discover how artificial intelligence is transforming business location decisions. Learn about AI-powered site selection, predictive analytics, and automated insights.