
US Retail Centre Coverage: Where Expansion Teams Have the Clearest Map
We analysed 10,596 mapped US retail centres and Census Vintage 2025 state populations to find where expansion teams have the strongest open retail-centre coverage.
Ahmed
Founder of Locus
US expansion teams often start with a simple question: where are the next viable retail markets? The answer is usually framed around population, migration and real estate availability. But before a location model can score opportunities, it needs a consistent map of the retail places being compared.
This Locus research analysed the GeoDS US Retail Centre Boundaries and Classification file, joined it to U.S. Census Bureau Vintage 2025 state population estimates, and asked a narrower question: which states have the largest mapped retail-centre universe, and how does that change when the count is normalised by resident population?
The headline is useful for franchise and property teams: California has the largest open retail-centre count in the file, with 1,618 centres, followed by Texas with 924 and Florida with 794. But among states with at least 2 million residents, Colorado and Oregon lead on centres per million residents.
This is not a site recommendation. It is a coverage study: a way to understand where a national retail-centre geography gives expansion teams the strongest starting frame for US location research.
Methodology
The retail-centre source is GeoDS US Retail Centre Boundaries and Classification. The local audit reads the downloaded GeoPackage directly and confirms 10,596 unique retail centres, no blank IDs, no duplicate centre IDs and coverage across all 50 states plus the District of Columbia.
Each centre includes state, county, place, street, a top-level group and a second-level type. The four top-level groups are everyday convenience and service centres, small city or neighbourhood centres, comparison and multipurpose shopping destinations, and major urban or established shopping destinations.
The population source is the U.S. Census Bureau Vintage 2025 state estimates. For each state and DC, the analysis uses POPESTIMATE2025, then calculates retail centres per million residents. Puerto Rico appears in the Census file but is excluded because the GeoDS retail-centre file used here covers the 50 states plus DC.
One caveat matters: the GeoDS page body includes a 10,956 figure, while the resource metadata and downloaded GeoPackage audit show 10,596 rows. This article uses the downloaded-file count and records the discrepancy rather than smoothing it over.
Top States by Mapped Retail Centres
| Rank | State | Retail centres | 2025 population | Centres per million residents |
|---|---|---|---|---|
| 1 | California | 1,618 | 39,355,309 | 41.1 |
| 2 | Texas | 924 | 31,709,821 | 29.1 |
| 3 | Florida | 794 | 23,462,518 | 33.8 |
| 4 | New York | 515 | 20,002,427 | 25.8 |
| 5 | Illinois | 395 | 12,719,141 | 31.1 |
| 6 | Ohio | 354 | 11,900,510 | 29.8 |
| 7 | Pennsylvania | 327 | 13,059,432 | 25.0 |
| 8 | Georgia | 306 | 11,302,748 | 27.1 |
| 9 | Virginia | 302 | 8,880,107 | 34.0 |
| 10 | New Jersey | 295 | 9,548,215 | 30.9 |
By raw count, the biggest states dominate. California accounts for 1,618 mapped centres, well ahead of Texas and Florida. New York, Illinois, Ohio and Pennsylvania form the next tier.
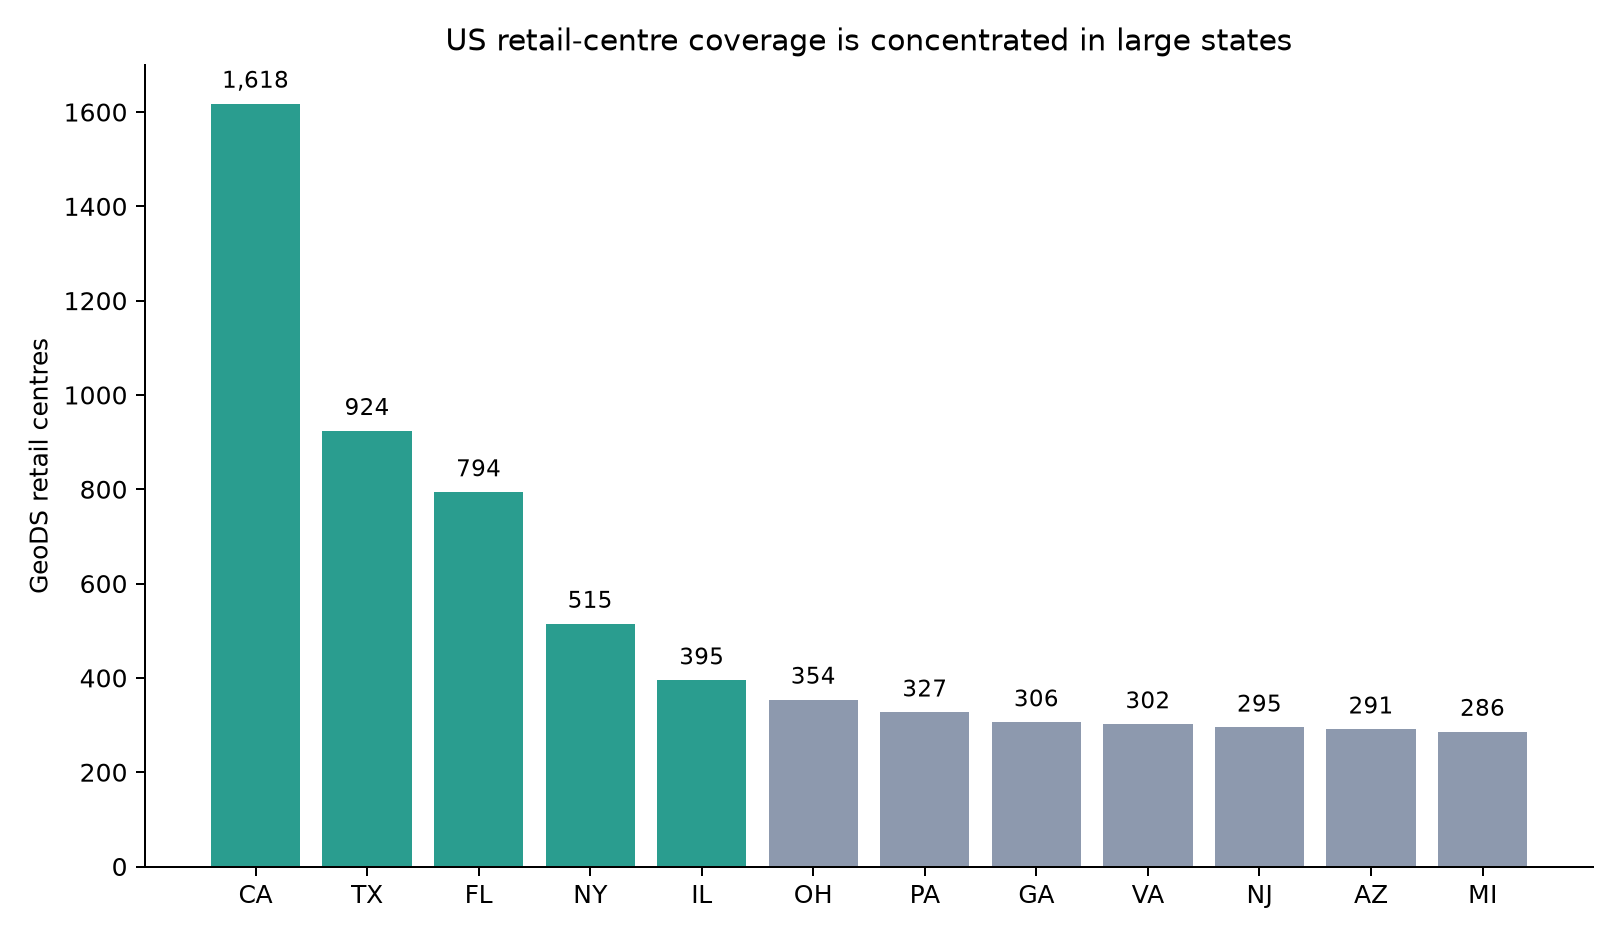
That list is useful for capacity planning. If Locus wants to build US market templates, competitor-monitoring examples or state-level retail research, these states provide the broadest mapped retail-centre base.
But raw count is also misleading. It mostly follows state size. A national expansion team does not only need to know where the most centres exist; it needs to know where the retail geography is dense enough to support granular market comparison.
The Per-Capita View Changes the Story
Among states with at least 2 million residents, Colorado leads with 45.2 mapped retail centres per million residents. Oregon follows at 43.3, then California at 41.1, Arizona at 38.2, Connecticut at 36.6 and Nevada at 36.6.
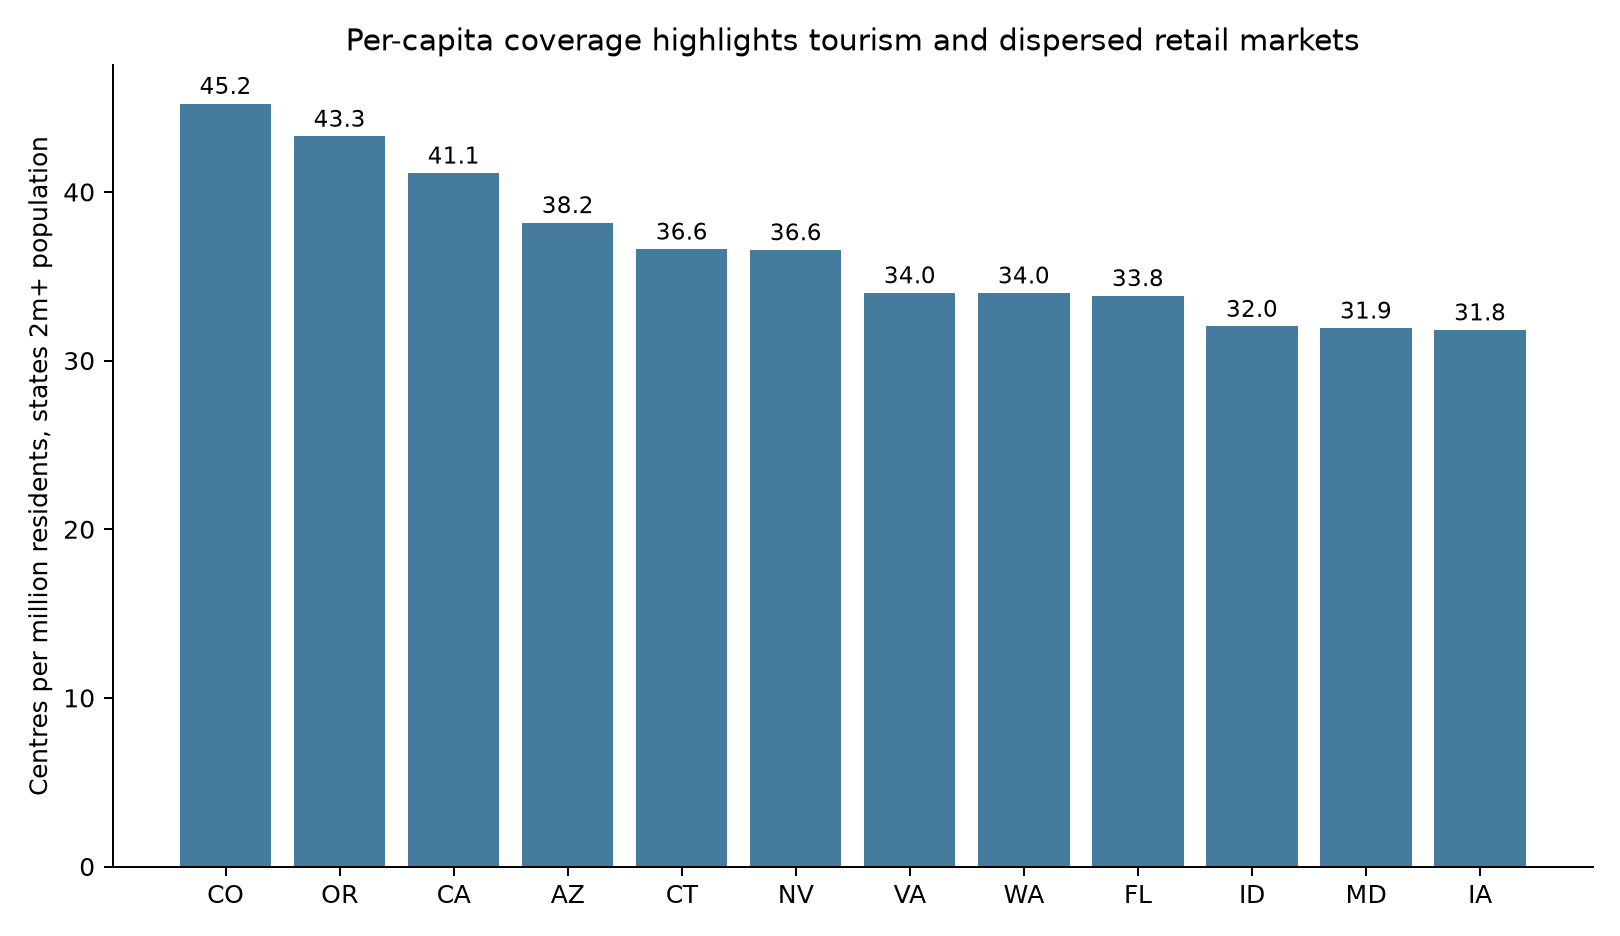
This does not mean Colorado or Oregon are the best states to open in. It means their retail-centre coverage is relatively dense against population, which can make them useful markets for pilot analyses, peer comparisons and route-to-market research. It also suggests that tourism, dispersed settlement patterns, suburban retail structure and local service-centre geography can matter as much as raw population.
For a franchise team, that is the practical point. California, Texas and Florida are obvious large-market candidates. Colorado, Oregon, Arizona, Connecticut and Nevada may be better places to test how a repeatable US retail-centre methodology behaves across different market structures.
What Type of Centres Dominate?
The mapped US retail universe is not mostly flagship downtowns or destination malls. Almost half of the centres, 47 percent, fall into the everyday convenience and service group. Small city, town and primary neighbourhood centres make up 26 percent. Major urban and established shopping destinations account for 15 percent, while comparison and multipurpose destinations account for 12 percent.
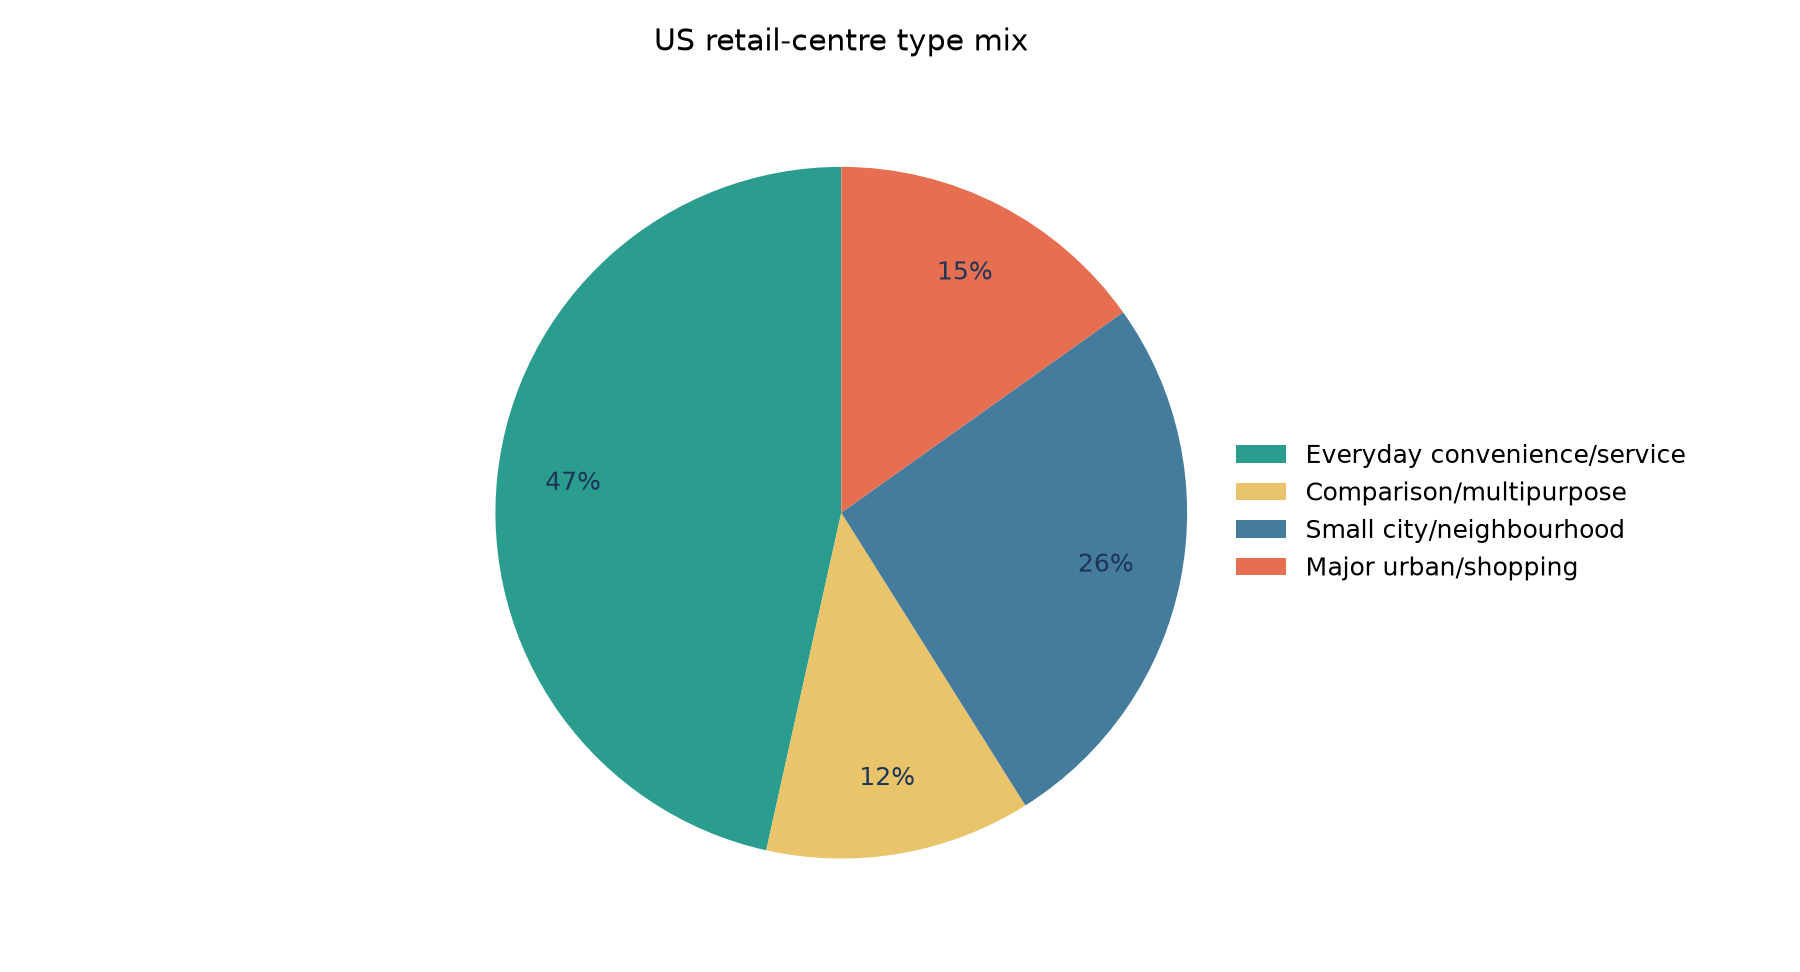
That mix matters for location intelligence. A US site-selection workflow should not focus only on trophy corridors. The most common mapped retail geographies are everyday places where operators compare convenience, access, local demand and nearby competitors.
What This Means for Expansion Teams
For franchise development teams, the study suggests a two-stage US workflow. First, use state-level coverage to choose pilot markets with enough retail-centre structure for meaningful comparisons. Then move to catchment-level analysis: demographics, competitors, traffic patterns, accessibility and site-specific constraints.
For CRE advisors, the value is consistency. A client can compare candidate properties more clearly when each site is anchored to a defined retail centre rather than a vague neighbourhood label.
For Locus, the study identifies a credible US research layer. Locus already supports US address search, competitor mapping and Census-tract demographics. A retail-centre layer can help future US content and product work group those signals into recognisable commercial places.
This same evidence-gate approach now informs the UK High Street Opportunity Index methodology, where Locus is holding the national ranking until four-nation coverage, peer-group and sensitivity checks are strong enough to support a public claim.
Next Study
The right next step is a city and category pilot, not a national opportunity ranking. A stronger follow-up would pick one US metro and one business type, then combine this retail-centre geography with current POI competition, local demographics, accessibility and Locus site-level analysis.
Good candidates are:
- Phoenix coffee or fitness locations, because Arizona ranks high on per-capita retail-centre coverage and has recent population growth.
- Denver neighbourhood service locations, because Colorado has the highest centres-per-million rate among states above 2 million residents.
- Dallas-Fort Worth franchise expansion screening, because Texas has a large absolute retail-centre universe and strong population growth.
That follow-up can make site-selection claims. This article should stay focused on coverage.
Caveats
This article does not rank states by opportunity. It ranks coverage and density of an open retail-centre geography. GeoDS US retail-centre temporal coverage is February 2022, so current openings, closures, rents, footfall and vacancies are not included. Any market recommendation needs a second-stage analysis using current local evidence.
All analysis was prepared for the Locus research workflow. Locus helps property and expansion teams compare catchments, demographics, competitors, demand signals and accessibility without the usual GIS complexity.
Run your own location study free at locusintel.io.
Keep reading
Related guides from the Locus library.
AI-Powered Location Intelligence for Local Business Growth
How Locus brings competitor mapping, demographics, foot traffic, catchment analysis, local reputation tracking, and AI recommendations into one practical workflow.
How AI is Revolutionizing Location Intelligence for Businesses
Discover how artificial intelligence is transforming business location decisions. Learn about AI-powered site selection, predictive analytics, and automated insights.