

Coffee expansion: a wider radius changed 37% of our eight-county shortlist
Across 3,277 residential tracts in eight US counties, widening the competitor radius from 1 km to 3 km replaced 37% of an illustrative expansion shortlist.
Locus Team
Location research
A coffee operator can receive a different expansion shortlist without a single business opening or closing. Sometimes the difference is a setting in the analysis: how far away a competitor counts.
In a reproducible screen of 3,277 residential Census tracts across eight US counties, increasing the competition radius from one kilometre to three kilometres replaced 123 of 332 shortlisted tract areas—37.0%. The underlying business records, demographic estimates and scoring weights stayed the same.
These are changes in an illustrative model, not evidence that the replacement areas will sell more coffee. The useful finding is that a seemingly technical choice can materially change which areas a team investigates next.
A radius is part of the business brief
Our baseline combined residential density, median household income and nearby mapped coffee-shop counts. Each county was scored separately, and its highest-scoring tenth of eligible tracts formed a shortlist.
The wider-radius test kept the first two inputs and the scoring priorities unchanged. It changed only the distance over which mapped coffee shops were counted. That retained 209 of the original 332 shortlist entries.
Every county changed, although the degree differed. Denver retained 13 of 17 entries; Mecklenburg County retained 11 of 21. The result is not an assertion that three kilometres is the right radius. A walk-up neighbourhood cafe and a drive-through concept may reasonably need different competitor sets. It is a reason to make that choice visible before treating a shortlist as settled.
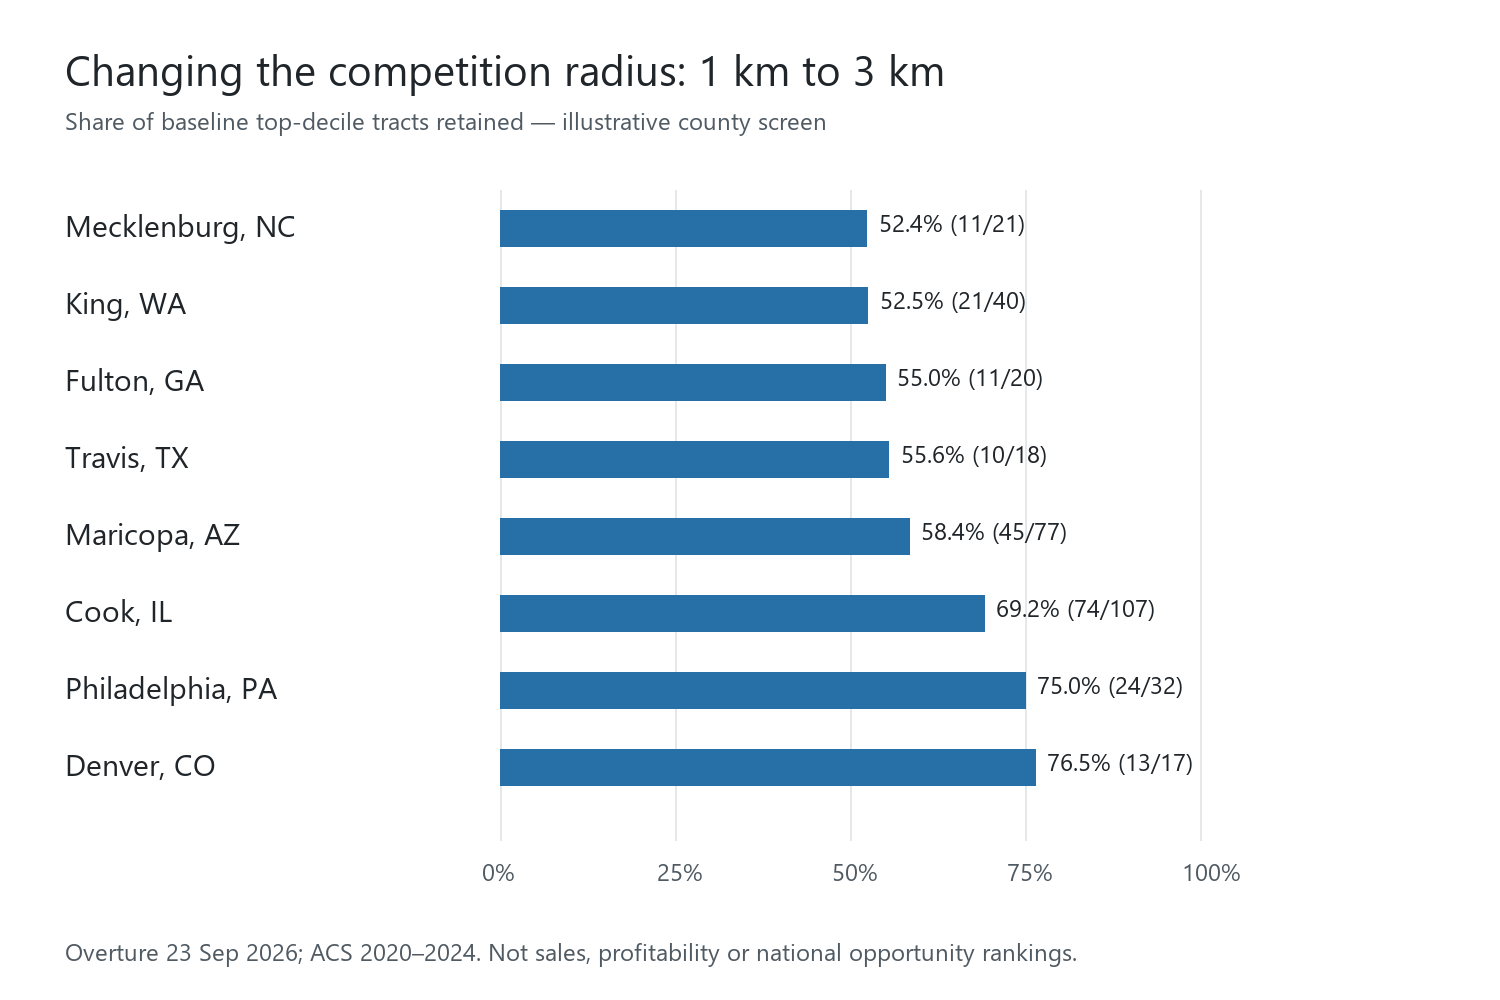
| County and state | Eligible tracts | Baseline shortlist | Retained with 3 km radius | Retained with coffee/cafe definition |
|---|---|---|---|---|
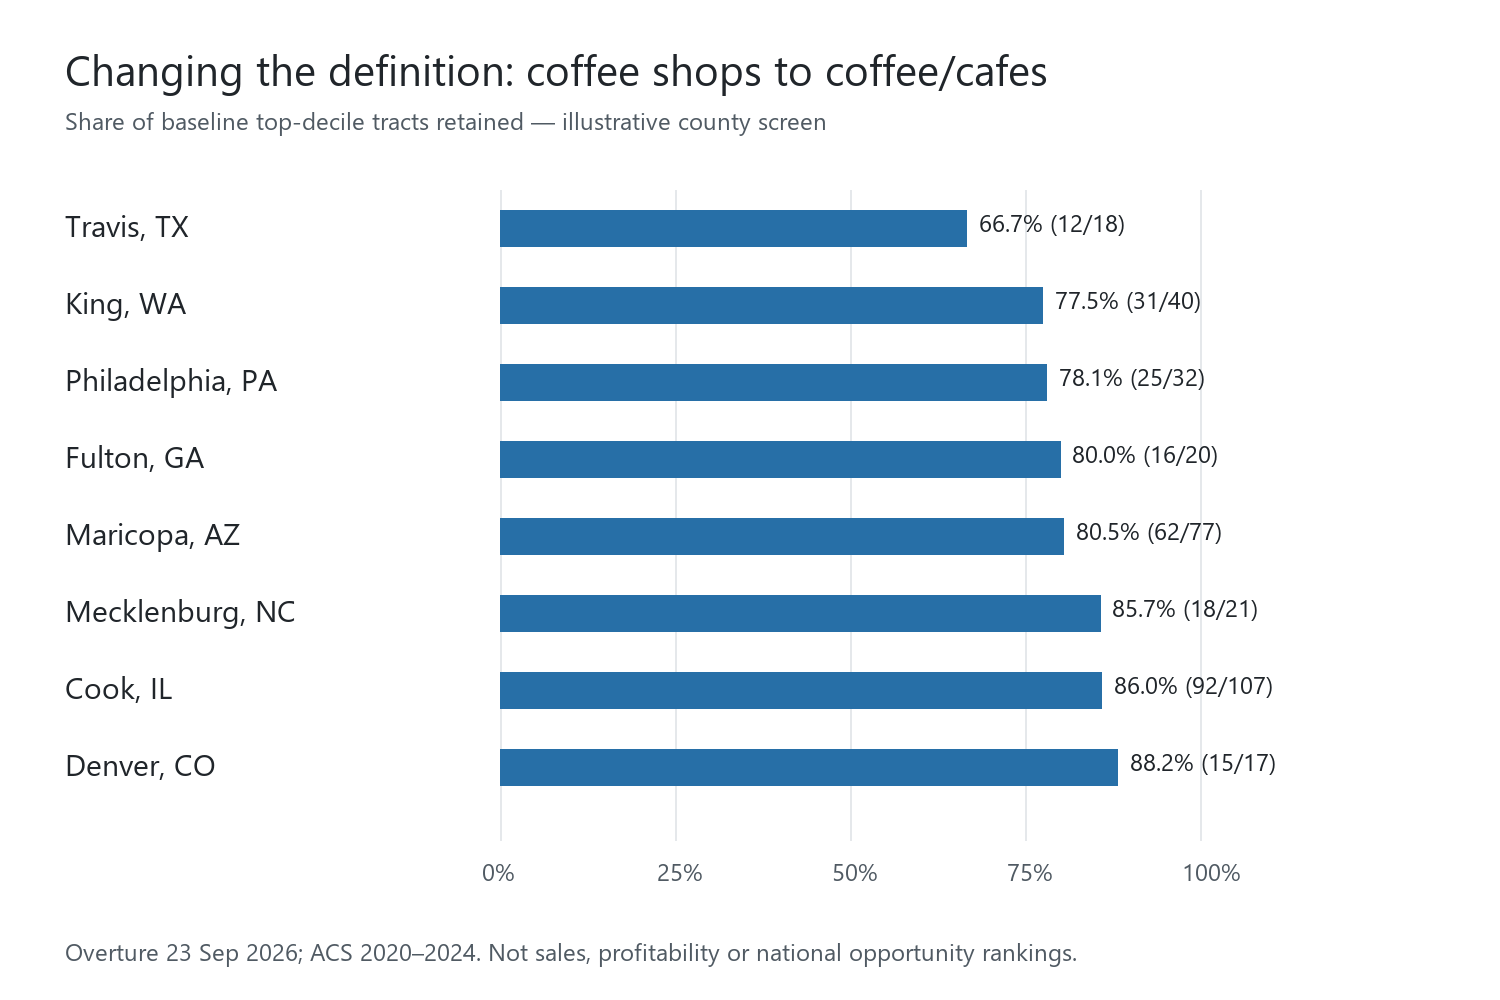
| Travis, Texas | 179 | 18 | 10 / 18 (55.6%) | 12 / 18 (66.7%) |
| Denver, Colorado | 163 | 17 | 13 / 17 (76.5%) | 15 / 17 (88.2%) |
| Fulton, Georgia | 198 | 20 | 11 / 20 (55.0%) | 16 / 20 (80.0%) |
| Mecklenburg, North Carolina | 202 | 21 | 11 / 21 (52.4%) | 18 / 21 (85.7%) |
| Cook, Illinois | 1,064 | 107 | 74 / 107 (69.2%) | 92 / 107 (86.0%) |
| Maricopa, Arizona | 763 | 77 | 45 / 77 (58.4%) | 62 / 77 (80.5%) |
| King, Washington | 396 | 40 | 21 / 40 (52.5%) | 31 / 40 (77.5%) |
| Philadelphia, Pennsylvania | 312 | 32 | 24 / 32 (75.0%) | 25 / 32 (78.1%) |
| All selected county screens | 3,277 | 332 | 209 / 332 (63.0%) | 271 / 332 (81.6%) |
The counties are associated with Austin, Denver, Atlanta, Charlotte, Chicago, Phoenix, Seattle and Philadelphia, but their boundaries are not interchangeable with city or metropolitan boundaries. Larger counties contribute more entries to the pooled result. Giving each county equal weight produced 61.8% average retention for the wider radius, compared with 63.0% pooled retention.
“Coffee competitor” is another consequential choice
A second test kept the one-kilometre radius and broadened the category definition from primary-category coffee shops to mapped coffee shops and cafes. Coffee-shop matches could appear in the primary, hierarchy or alternate fields; cafe matches had to appear in the primary or hierarchy fields. A cafe alternate alone did not qualify.
That change replaced 61 of 332 entries—18.4%. It was less disruptive than widening the radius, but still changed the proposed investigation list in every county. The screen did not automatically include every restaurant, bakery or fast-food outlet that might sell coffee.
For an operator, the right question is which venues compete for the same customer occasion. A cafe with a substantial food offer may matter to a breakfast-led concept, while being a weaker comparison for a commuter espresso kiosk. A database category cannot settle that commercial judgment.
The finding survives checks—but those checks have limits
Changing the existence-confidence filter from 0.8 to 0.7 replaced 17 baseline entries, or 5.1%; raising it to 0.9 replaced 13, or 3.9%. Those changes were smaller than the radius or category changes in this screen. Overture describes confidence as an existence-filtering measure that is not strictly comparable across providers; it is not a probability that a business is currently open. Overture Places guidance.
We also checked ties. Mecklenburg's baseline cutoff includes two equally scoring tracts competing for the last fixed-size place. Including every tract tied at the cutoff increased the combined baseline to 333 entries. The wider-radius test then replaced 124 of 333, or 37.2%, so the central result was not created by choosing one tied tract over another. Some other cutoff gaps are very small: the Denver baseline's gap was about 0.03 points on the illustrative 0–100 score. A shortlist boundary is not a meaningful wall between good and bad locations.
The ACS estimates carry sampling uncertainty. In 200 pre-specified stress tests, we independently varied each retained tract's population and income within its published estimate-plus/minus-margin-of-error range, and compared the two radius settings under the same perturbed demographics. Radius-related replacement ranged from 34.6% to 42.5%, with a median of 39.0%. Category-related replacement ranged from 14.5% to 21.1%.
Those are descriptive stress-test ranges, not confidence intervals. The simulation assumes independent uniform perturbations; the real covariance between estimates is unknown. It keeps the eligible set fixed, and 35 retained tracts have population-minus-margin-of-error below the 1,000-resident eligibility threshold. The files separately report that boundary issue.
A fresh release is not a field inspection
The business records came from Overture's 23 September 2026 release, the latest available in its official catalog when collected on 14 October. That is the release date, not a guarantee that every name, category or trading status was independently observed that month. Official Overture catalog.
Overture explains that its US operating-status values use contributed signals, while some records have no status value. We excluded records explicitly labelled closed, retained unknown status as unknown and saved the underlying provenance. Overture's operating-status explanation.
A bounded issuer-website check also found an exact-address conflict: the dataset marked OCF Coffee House at 2100 Fairmount Avenue as open, while its parent company's page reports closure and lists that branch. We excluded that matched record, kept the original source rows and pre-correction results, and re-ran every calculation. The headline radius and category retention totals were unchanged. The closure date is not established, so we cannot say when the dataset's status became wrong; a different OCF-address record was not automatically removed.
The initial website check covered sixteen fixed, website-bearing coffee/cafe records from the eight extraction boxes, not a representative venue census. Some checks supported a published address, coffee offer and operating indication together; others remained partial, unavailable or conflicting. We then traced the checked records into the actual scored circles and reviewed priority nearby-name conflicts. Website failures, a generic store-locator redirect or absence from a directory were not treated as closure evidence. Published hours are not a physical visit.
Our final category-rule review also corrected an implementation discrepancy: seven bubble-tea records had qualified only through an alternate cafe label, which the locked method did not permit. Removing them changed fourteen one-kilometre anchor counts but neither headline shortlist total. The original outputs and the correction are preserved. This is a method repair, not a claim that bubble-tea shops cannot compete with coffee shops.
We flagged 34 same-name pairs within 50 metres and 665 differently named pairs within 20 metres in the pre-correction extraction. Those are review candidates, not confirmed duplicates. Multiple counters may share a building; different names can also describe historical replacements. Operator evidence can establish a current offer without resolving every older name at the same address.
To test whether these issues drove the finding, we added explicit business-record stress tests after the main analysis. Each treatment was applied to both the baseline and its comparison, with eligibility and scoring unchanged:
- Removing the fixed sample's unresolved records left the two headline results unchanged.
- Keeping one deterministic record per flagged nearby group also left pooled radius/category replacement unchanged, although it changed ten baseline shortlist entries. It was a stress scenario, not an approved merge.
- Removing all 827 active records in those flagged groups increased radius replacement to 38.0% and category replacement to 19.3%.
- Retaining only records with source status “open,” rather than open or unknown, produced 36.1% radius replacement and 19.3% category replacement. A source “open” flag is still not independent operator verification.
Separate format checks excluded three flagged records—a nutrition club, a gaming cafe and an operator-confirmed infused-coffee format—or excluded specialist cafe taxonomy. Across all the additional business/category treatments, radius replacement stayed between 36.1% and 38.0%; category replacement stayed between 18.1% and 19.3%. These are disclosed post-analysis scenarios, not pre-registered findings, error-rate estimates or worst-case bounds. They do not account for every possible missing venue. Individual areas still need current operator/menu and exact-unit checks before a commercial decision.
What expansion teams should ask for
An expansion screen should make four questions easy to answer:
- What decision does the radius represent? Distinguish a geographic circle from a walking or driving catchment, and explain which customer trip the concept targets.
- Which businesses count as competitors? Show the category rules and inspect menus, format and price point for the shortlisted areas.
- Which entries are stable? Compare the same areas under defensible alternative assumptions and show the entries that appear only under one setting.
- What still needs site-level evidence? Check premises availability, rent, access, daypart traffic and unit economics before treating an area as an opening recommendation.
Our five-point Chicago specialty-coffee example asks a different question about selected local candidate points. This study instead tests how an explicit residential-area screen changes across a much larger set of fixed anchors. Neither substitutes for a premises-level commercial case.
Method and reproducible evidence
The eight counties were selected before scoring to span different regions and urban forms, not to represent the whole United States. We retained all matching tracts with at least 1,000 estimated residents, land area above zero and no greater than five square kilometres, positive median household income, and usable population/income relative margins of error no greater than 50%. That retained 3,277 of 4,344 source tracts and excluded 1,067. It excludes many large suburban and low-resident commercial tracts, which is a material limitation for drive-through, commuter and visitor-led expansion.
Each anchor is a Census tract internal point, not an available storefront. Its residential density and income describe the tract, not the population or spending within the competition circle. Distances are great-circle distances, not travel times. Every final anchor's three-kilometre circle was checked against the actual extraction footprint.
The baseline uses within-county averaged-tie percentile ranks: 50% residential density, 20% median household income and 30% inverse mapped competitor count. Higher income/density and fewer mapped competitors are declared assumptions of this illustrative concept; fewer records do not establish unmet demand. We retained raw score precision, rounded shortlist size upward to a whole tract and resolved exact score ties by tract identifier. Alternative commercial weights and combined category/radius results are included in the evidence files, not described as model errors.
Demographic inputs are the 2020–2024 ACS five-year estimates and corresponding 90% margins of error, joined to the aligned 2024 Gazetteer. They are the latest released small-area estimates used here, not 2026 demographic observations. The Census Bureau has announced 29 October for public release of the 2025 one-year estimates, which are a different product and do not replace tract-level five-year coverage. ACS Summary File, Census geography vintages, 2025 one-year release announcement.
The accompanying full tract/scenario table, county retention table, executed analysis notebook, business/category checks and locked protocol retain the calculations, exclusions and source trail. Independent checks re-derived every demographic input and score/shortlist row. A separate distance/category implementation checked all 13,108 counts across the four main scenarios, alongside 192 spherical-law-of-cosines spot checks. Files preserve Overture per-source licence metadata; attribution follows its licensing guidance.
This study was prepared by Locus, a location-intelligence business. The calculations were checked against the saved source data. It does not evaluate an AI model, predict sales, measure footfall, inventory vacant premises or establish profitable locations. Its narrower contribution is showing how the screening assumptions themselves change an expansion team's next investigation list.
Download and inspect the evidence
Read the executed analysis companion, or download the calculation and evidence package and the separate frozen original inputs (49.9 MiB). The reproduction instructions and source notices explain how to combine the two downloads and check their hashes.
Source attribution: Overture Maps Foundation, overturemaps.org; Places data accessed 14 October 2026. Includes Foursquare data, copyright 2024 Foursquare Labs, Inc. All rights reserved, transformed to the Overture schema (changed 2026-03-18), and other providers under their per-record terms. Full source notices, licences and unchanged per-record provenance accompany the downloads. U.S. Census Bureau demographic inputs are identified above. Source providers do not endorse this study.
Keep reading
Related guides from the Locus library.
AI-Powered Location Intelligence for Local Business Growth
How Locus brings competitor mapping, demographics, foot traffic, catchment analysis, local reputation tracking, and AI recommendations into one practical workflow.
How AI is Revolutionizing Location Intelligence for Businesses
Discover how artificial intelligence is transforming business location decisions. Learn about AI-powered site selection, predictive analytics, and automated insights.